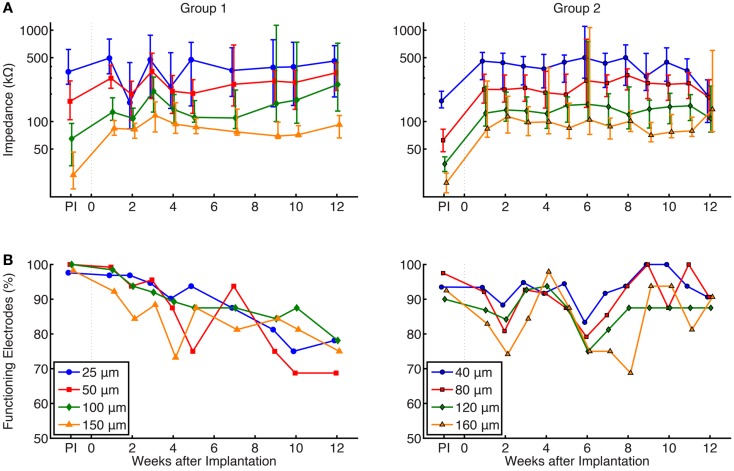
Figure 6.
(A) Summary of chronic impedance measurements of all arrays. The line plots show the median impedance of the eight different electrode site sizes, with error bars representing the 75th and 25th percentiles of the data. The pre-implant (PI) impedance values, measured immediately before preparation for surgical implantation, are also shown. Electrodes with impedance >2 MΩ or <10 kΩ were considered non-functional and were not included in these graphs. Impedances were inversely correlated with site size and median impedances of functioning electrodes remained stable within a range of 50–500 kΩ while implanted. Results of a Kruskal–Wallis test showed that site size was statistically significant (p < 0.01) in both groups, while the effect of time was not significant (p = 0.86 and 0.35 for groups 1 and 2, respectively.) (B) Percentage of implanted electrodes with impedances <2 MΩ and >10 kΩ. Each time point represents all implanted electrodes at each week, while electrodes from FMAs that suffered catastrophic failures were not included. Around 70–80% of group 1 and 90% of group 2 electrodes that remained implanted were functional at 12 weeks.

