Figure 3.
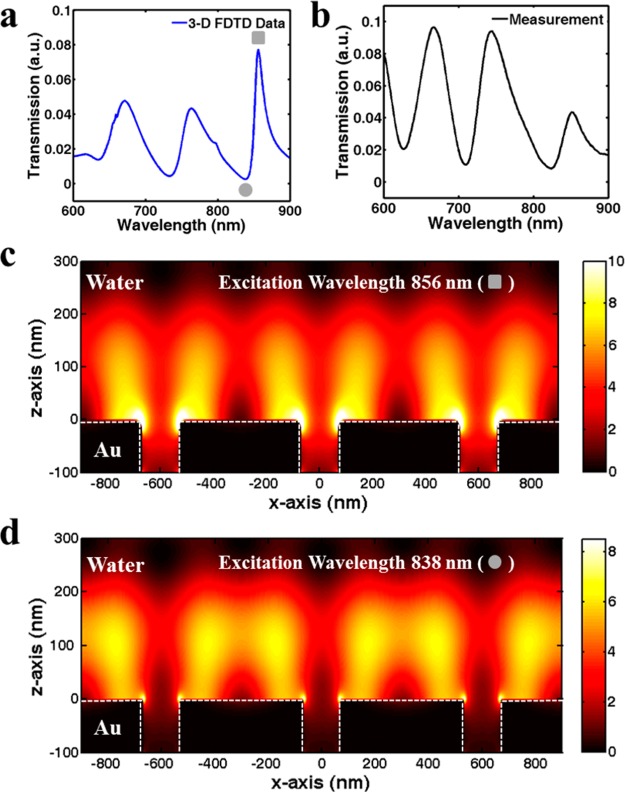
Three-dimensional FDTD simulations. (a) Simulated and (b) measured transmission spectra from the periodic gold nanohole arrays. The resonances associated with gold–water interface are marked. (c,d) Time-averaged electric field intensity distribution around gold nanohole arrays immersed in water at the excitation wavelengths of 856 and 838 nm, respectively.

