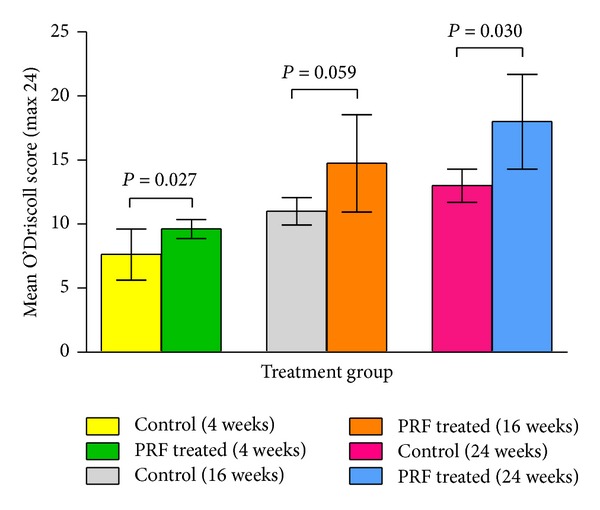
Figure 5.

Mean O'Driscoll scores for histological evaluation of the repair tissue in the control and PRF treated groups at different time intervals. Error bars indicate standard deviation (SD) and the P values represent the statistical differences between the two treatment groups.
