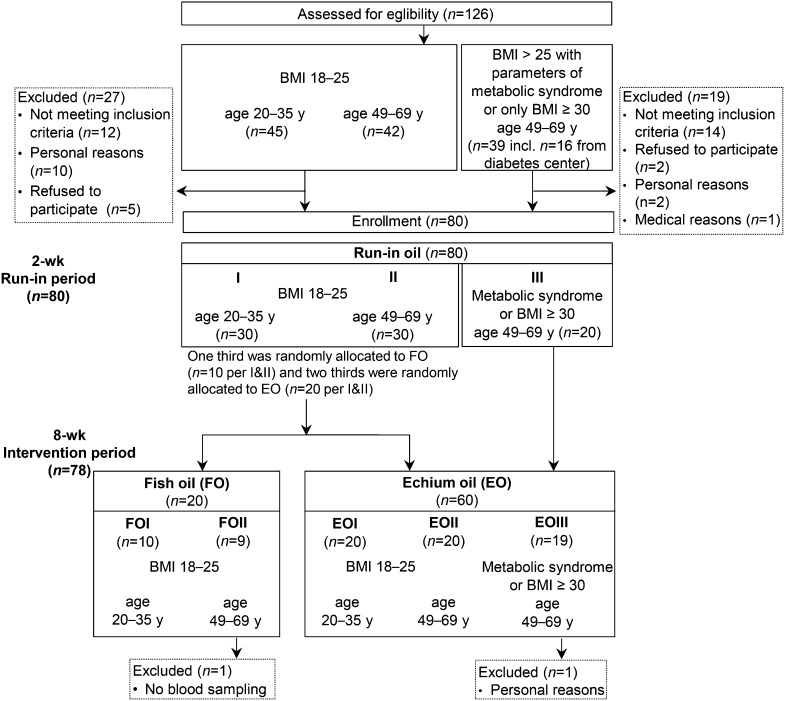
FIGURE 1.
Flow diagram of individuals recruited and allocated to the treatment subgroups. Age is shown in years, and BMI is shown in kilograms per square meter. Sex was balanced in each subgroup. EO, echium oil; EOI, participants aged 20–35 y with BMI = 18–25 kg/m2, treated with EO; EOII, participants aged 49–69 y with BMI = 18–25 kg/m2, treated with EO; EOIII, participants aged 49–69 y with BMI > 25 kg/m2 and markers of metabolic syndrome or with BMI ≥ 30 kg/m2, treated with EO; FO, fish oil; FOI, participants aged 20–35 y with BMI = 18–25 kg/m2, treated with FO; FOII, participants aged 49–69 y with BMI = 18–25 kg/m2, treated with FO.

