
Figure 2. The main peak activation for the presence of any delay of vocal feedback, over the no delay condition ([200 ms, 125 ms 50 ms]>0 ms).
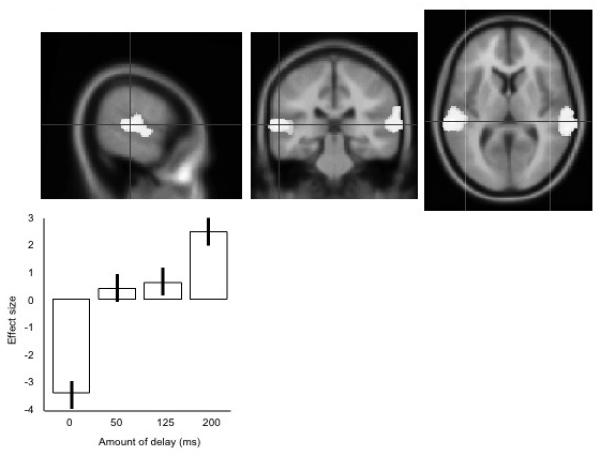
The upper panels show the data projected onto an averaged structural MRI image, showing (from left to right) sagittal, coronal and transverse sections. The lower panel shows the mean effect sizes at this peak location, across the four conditions, centred around zero. Error bars show the standard errors of the parameter estimates.