
Figure 4. The peak activation for the contrast (200 ms>125 ms>50 ms>0 ms), masking exclusively for the contrast ([200 ms, 125 ms 50 ms]>0 ms).
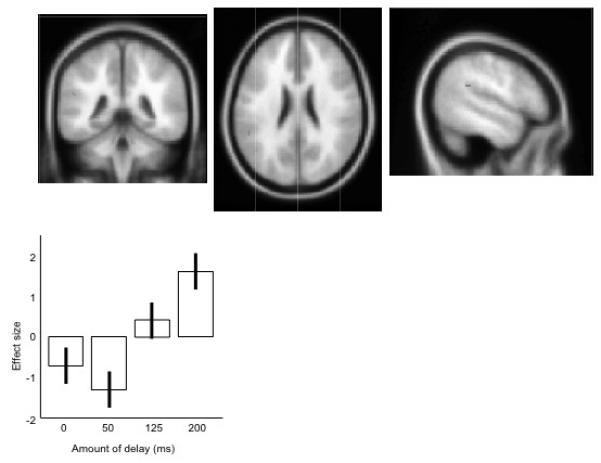
The upper panels show the data projected onto an averaged structural MRI image, showing (from left to right) coronal, transverse, and sagittal sections. The lower panel shows the mean effect sizes at this peak location, across the four conditions, centred around zero. Error bars show the standard errors of the parameter estimates.