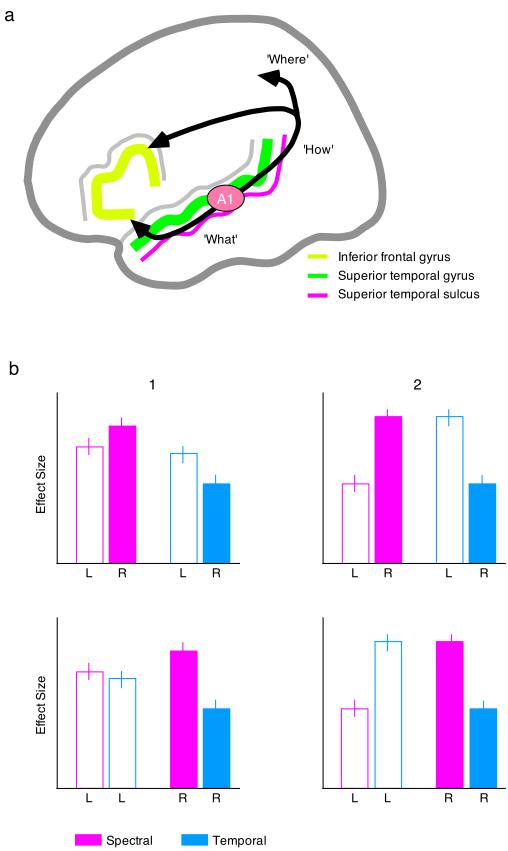
Figure 2. Locations and configurations of hemispheric asymmetries.
There are several different distinct auditory, heteromodal and prefrontal regions which are seen in speech and sound processing. Generally, the field is open minded about where (PAC, STG, STS, IFG) hemispheric asymmetries might be identified, although different interpretations might be made of the consequences of asymmetries in these different cortical areas. Thus asymmetries in primary auditory cortex might lead to an assumption that speech (and sounds that share its hypothesized acoustic features) is selectively processed from its earliest encoded entry into the cortex. Asymmetries in the superior temporal gyrus might point to somewhat later acoustic selectivity process, while asymmetric responses in the STS and IFG could arguably be related to non-acoustic sensitivities. Furthermore, the rostral/causal orientation of anatomically and functionally distinct streams of auditory processing may be important in interpreting the results of such functional imaging studies.
The bar charts in the lower section use hypothetical data to illustrate how different ways of plotting effect sizes can lead to varying interpretations of the data. The plots on the right of the figure (1) reflect potentially valid hemispheric asymmetries according to the hypothesis of Zatorre and colleagues (i.e. the left responds selectively to temporal information, and the right prefers spectral properties), while the plots on the left (2) show effects driven by an acoustic selectivity in the right hemisphere response only. The responses of the left and the right hemisphere are illustrated using clear and filled bars, respectively, with the only difference between the upper and lower panels being the order in which the bars are arranged. Note that the similarities between the two upper panels disappears when the results are plotted by hemisphere, rather than by condition.

