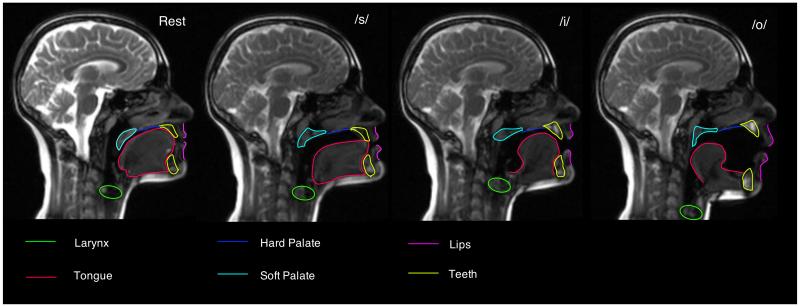
Figure 3. Configurations of the vocal tract.
This figure shows images from a real-time MRI sequence during which an adult speaker of British English produced continuous speech. The leftmost panel shows the articulators at rest. The next panels show the configurations associated with the speech sounds, ‘s’, ‘eee’ and ‘aw’, respectively.

