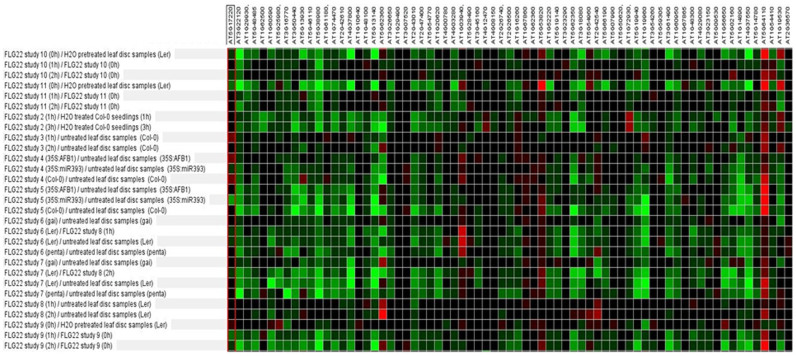
Figure 2. Co-regulation of F. oxysporum-repressed Arabidopsis root genes.
Shown is a heat map with different intensity gene expression of FLG22-treated Arabidopsis plants for the genes that were identified in this study to be repressed in F. oxysporum-infected roots. Red = induced, green = repressed gene expression; data were extracted from Genevestigator26.

