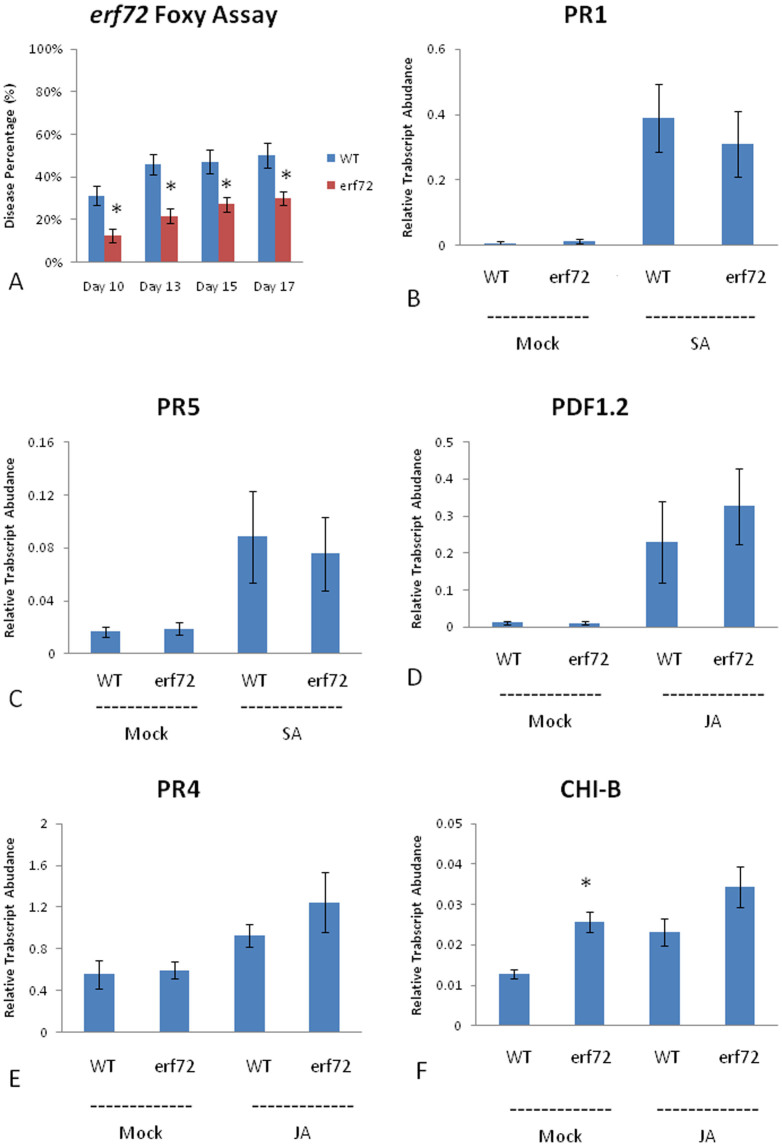
Figure 3. Disease scores for erf72 mutants and different relative gene transcript abundances for WT/erf72 plants with JA or SA treatments.
The disease scores represent the average proportion of symptomatic leaves per total leaves per plant. An asterisk (*) indicates a p-value < 0.05; bars represent mean values ±SE of three independent biological replicates containing 10 pooled plants each (or 30 pooled plants each for qRT-PCR data).

