Figure 3.

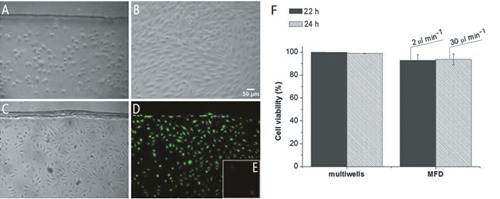
HUVEC in the channel of a MFD. A) 2 h, flow absent in order to promote cellular adhesion. B) 20 h with 2 µL min–1 medium flow rate; cells subjected to a flow rate of 30 µL min–1 for 2 h (C) are analyzed by Live/Dead assay. D) Green fluorescence of calcein in viable cells. E) Red fluorescence of PI in dead cells; images recorded with a DM-IRE2 microscope (phase contrast images) and a fluorescence microscope (Leica Microsystems). F) Percentage of live cells in multiwells or in MFD after 22 h (2 h flow absent + 20 h 2 µL min–1) and 24h (2 h flow absent + 20 h 2 µL min–1 + 2 h 30 µL min–1). The data represent mean±SD (2≤n≤4).
