
Figure 1.
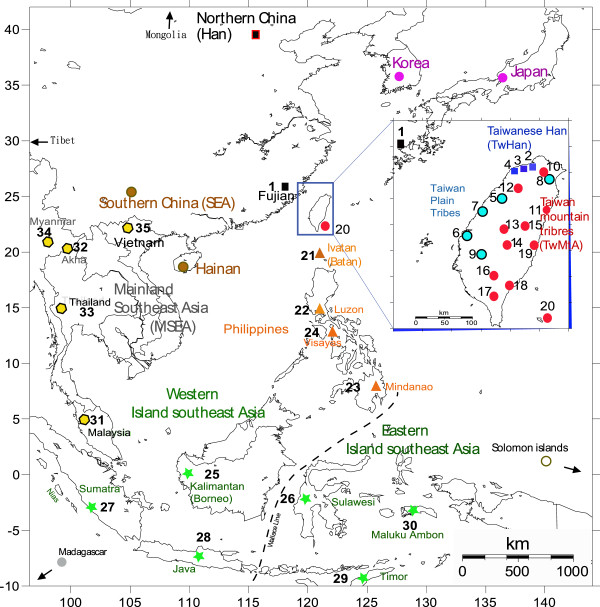
Geographic map showing the locations of the samples of Fujian, Taiwan, the Philippines and Indonesia genotyped in this study. Group numbers identifying sampling locations are described in Table 1, and color codes are : Black squares = Mainland Han, Dark blue squares = Taiwan Han, Sky blue circles = Taiwan Plain tribes, Red circles = Taiwan Mountain tribe Aborigines, Orange triangles = Philippines, Green stars = Indonesia, Yellow hexagons = Indochina (Indochina). The Wallace’s line (black dotted line) separates Eastern ISEA from Western ISEA. Locations without a number indicate groups obtained from additional literature (Additional file 1: Table S1), namely: Brown circle = Yueh/Daic/Hainan in south China, Grey = Madagascar, White = Solomon island, Pink = Japan and Korea, and Black with red frame = North China.