
Figure 3.
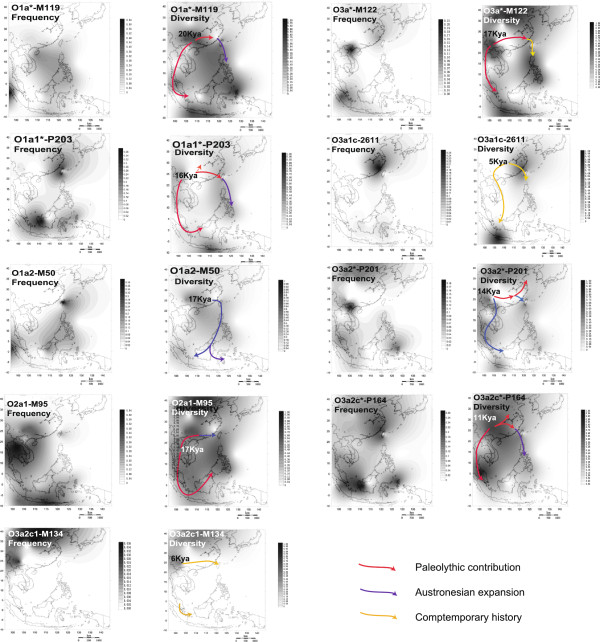
Spatial distributions of the O1, O2 and O3 clades using haplogroup frequency and associated STR diversity (rho statistic). Maps are based on data from Additional file 1: Tables S1 and S2 and from literature data [12,27,30,36,39,40,62]. Panels are labeled according to ISOGG2011 [8,42,43]. Arrows symbolize dispersals and gene flow, and stages (B, C and D) are according to Karafet et al. [26] (see Discussion section). The age at the beginning of arrows represents the likely time of origin of the haplogroup as estimated from its STR diversity (Table 2 and Additional file 1: Table S3), and arrow colors represent time of dispersal (red for Paleolithic, blue for Neolithic/Austronesian expansion and yellow for contemporary historical times).