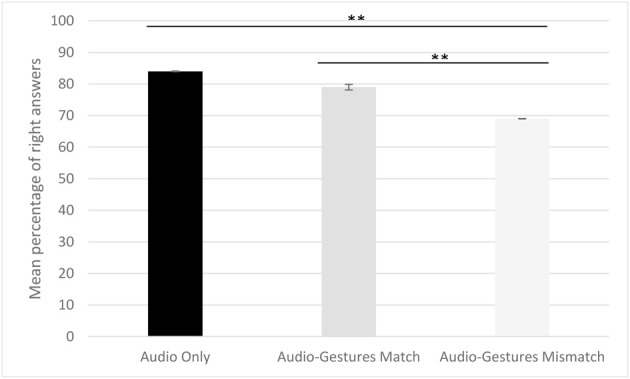
Figure 3.

Mean percentage of right answers in the audio only, the match and mismatch conditions of Experiment 2. Participants' mean percentage of right answers is higher in the audio and matching conditions than in the mismatching one (**p < 0.0001). Errors bars represent the standard deviation.
