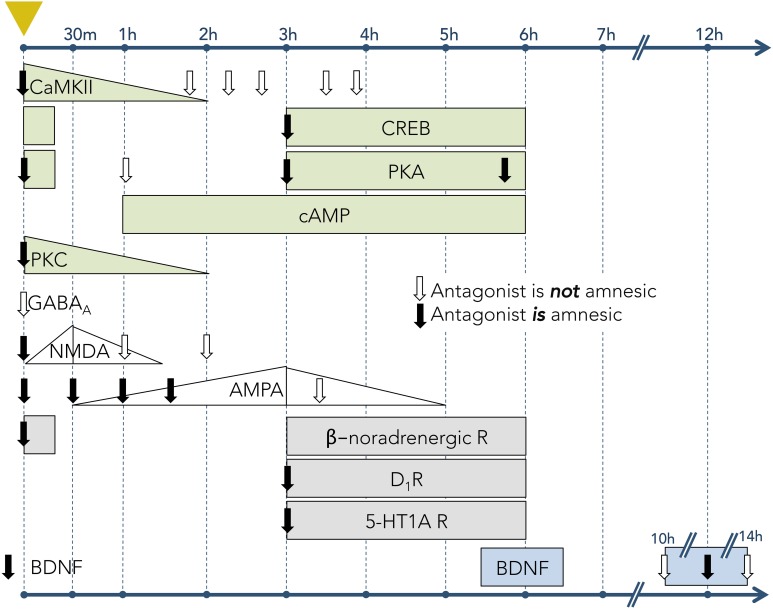
Figure 3.
Timecourses of activity for learning-associated molecular mechanisms in hippocampal tissue following one-trial inhibitory avoidance (IA) training. Leftmost dashed vertical line (marked with yellow triangle) denotes the time of IA conditioning. Subsequent vertical lines denote timepoints following the trial. Rows correspond to particular mechanisms (signaling molecule, receptor, or neuromodulator). Downward-pointing arrows indicate timepoints when antagonists to the corresponding receptor or signaling pathway were infused into the hippocampus; solid arrows denote that the antagonists had an amnesic effect on LTM (when tested 24–48 h after conditioning); open arrows indicate no amnesic effect on LTM. Filled shapes denote the experimentally-measured expression levels of receptors or signaling molecules. Increasing or decreasing levels are depicted when known; rectangles depict measurable levels when relative abundances were not measured. Light green shapes represent intracellular signaling pathways, including Ca2+/calmodulin-dependent protein kinase II (CaMKII), cAMP response element-binding protein (CREB), protein kinase A (PKA), cyclic adenosine monophosphate (cAMP), and protein kinase C (PKC) (Data from: Jerusalinsky et al., 1994; Wolfman et al., 1994; Bernabeu et al., 1996, 1997a,b; Bevilaqua et al., 1997; Cammarota et al., 1997; Izquierdo et al., 1997). White shapes represent ionotropic receptors for neurotransmitters, including γ-Aminobutyric acid A (GABAA) receptors, N-methyl-D-aspartate (NMDA) receptors, and α-amino-3-hydroxy-5-methyl-4-isoxazolepropionic acid (AMPA) receptors (Data from: Izquierdo et al., 1992; Jerusalinsky et al., 1992; Bernabeu et al., 1997c). Gray shapes represent the activity of receptors for neuromodulators, including β-noradrenergic receptors, dopamine type 1 receptors (D1R), and serotonin 1A receptors (5-HT1A) (Data from: Izquierdo et al., 1992; Bernabeu et al., 1996; Bevilaqua et al., 1997). Blue shapes represent brain-derived neurotrophic factor (BDNF; Data from Bekinschtein et al., 2007).

