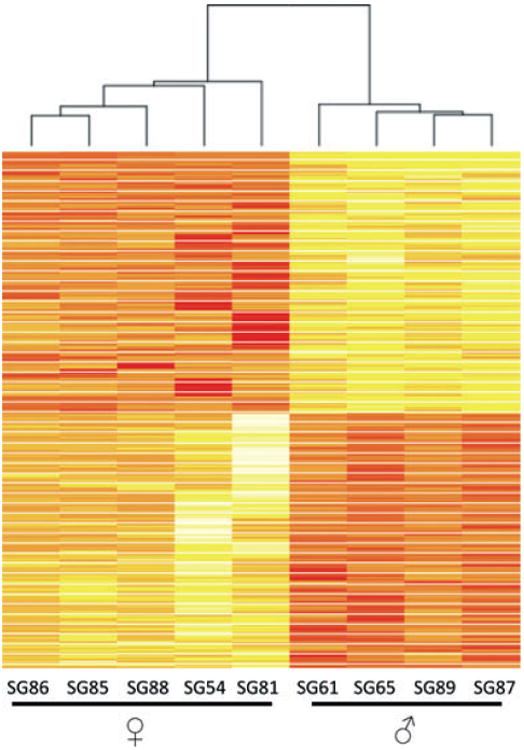
Figure 1.

Heat map of differentially expressed genes meeting the moderate statistical threshold. Color intensity correlates with the degree of gene expression. Rows are normalized to set the mean at zero, with the standard deviation set at ±1. Rows colored in red are repressed while yellow represents upregulated transcripts
