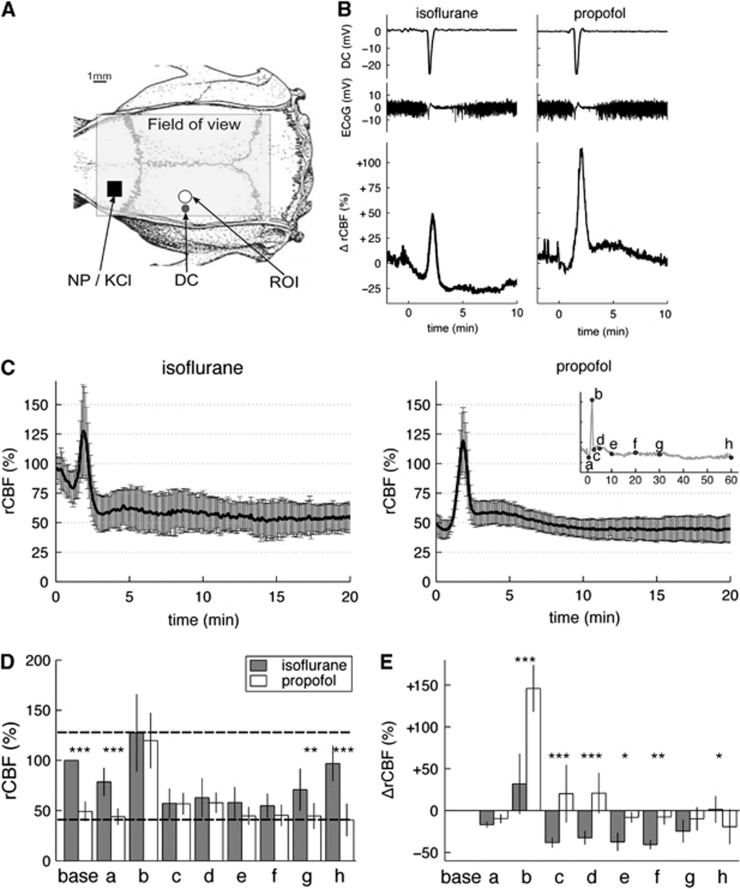
Figure 1.
Regional cerebral blood flow (rCBF) responses to induced cortical spreading depolarizations (CSDs) under isoflurane or propofol. (A) Experimental setup. The field of view for laser speckle imaging (LSI) was ∼12 × 7 mm. Cortical spreading depolarizations were induced either by needle prick (NP) or epidural 3 mol/L KCl application in the frontal lobe (black square). A circular region of interest (ROI) of 1 mm diameter was placed 5 mm posterior to the CSD induction site. This ROI was analyzed for rCBF in groups 1 to 3. A direct current (DC) microelectrode (black circle marked DC) was implanted ∼5 mm posterior to the CSD induction site and 4 mm lateral to midline. (B) Representative electrophysiological (top traces) and relative ΔrCBF responses (bottom trace) to a single CSD wave induced alternatively under isoflurane (left) and under propofol (right) anesthesia in the same animal (experimental group 1). Time t=0 was the time of the NP. Baseline DC potential and baseline ΔrCBF were taken as the average value over 2 minutes before each NP and set to 0. (C) Average time courses of the rCBF responses to a single CSD in five animals under isoflurane (left) and propofol (right) shown as mean±s.d. (error bars). The rCBF 100% value was given as the average value over 2 minutes before NP under isoflurane anesthesia. (D) Bar plots of the rCBF values under isoflurane anesthesia (dark gray bars) and propofol anesthesia (white bars) at characteristic time points (a to h) defined as per insert in (C). Point ‘base' refers to resting-state rCBF, calculated as the average rCBF value over 2 minutes before NP. Bar heights are the mean values and error bars the s.d. over five animals. Horizontal dashed lines indicate maximum and minimum rCBF levels (given by the maximum bar height and minimum bar height across all time points and both anesthetics). (E) Bar plots of ΔrCBF values under isoflurane (dark gray) and propofol (white bars) at the same characteristic time points (a to h). The relative changes, ΔrCBF, were calculated on a % scale with 0% taken as the resting-state baseline rCBF before needle prick, irrespective of the anesthesia regimen. More details about the relative ΔrCBF can be found in Supplementary Information S5. Significance of the factor ‘anesthesia' on the levels of ΔrCBF and rCBF within each different time point was tested by multiple pairwise comparisons after two-way repeated measures analysis of variance: *P<0.05, **P<0.01, ***P<0.001.

