Figure 3.
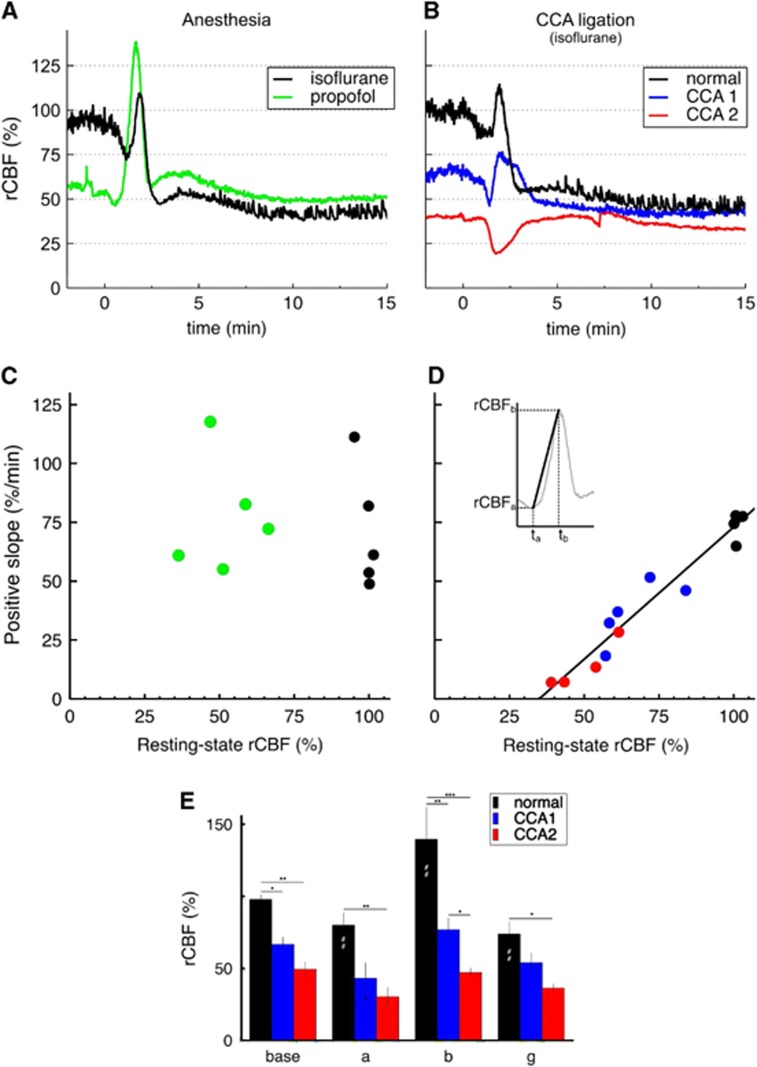
Regional cerebral blood flow (rCBF) response after common carotid artery (CCA) ligation and correlation between the positive slope of rCBF response and resting-state rCBF. (A) Exemplar rCBF responses to cortical spreading depolarization (CSD) induced by sequential needle pricks under different anesthesia regimens (experimental group 1): either isoflurane (black) or propofol (green). (B) Exemplar rCBF responses to CSD induced by sequential needle pricks under different upstream blood supply conditions (experimental group 3): normal blood supply to the brain (black), after ligation of the left CCA (blue), and after ligation of both CCA (red). All rCBF time courses shown were extracted from the same region of interest defined in Figure 1A, i.e., lying in the territory of the middle cerebral artery. Regional cerebral blood flow 100% was taken as the average inverse correlation time value 2 minutes before needle prick under isoflurane and normal blood supply to the brain. Time 0 is the time of each respective needle prick. See also Supplementary Movie. (C) Scatter plots of the positive slope of rCBF response versus resting-state rCBF in cases of different anesthesia regimens in n=5 animals (experimental group 1, black for isoflurane, green for propofol). (D) Scatter plots of the positive slope versus resting-state rCBF in cases of different brain blood supply for n=5 animals (experimental group 3). Same color code as in (B). In one animal, a spontaneous CSD wave propagated after bilateral CCA ligation, and thus no third needle prick was performed (only four red points). Resting-state rCBF values were defined as the average rCBF values 2 minutes prior each needle prick (with 100% rCBF taken under isoflurane with normal blood supply). The positive slope was calculated for each rCBF wave by the ratio (rCBFb− rCBFa)/(tb−ta) (see insert). Parameters for the linear regression in (D) are as follows: y=1.12 × x−39.3, R2=0.947. (E) Cerebral blood flow response to CSD under normal conditions (n=5) and during unilateral (CCA1, n=5) and bilateral (CCA2, n=4) CCA ligation. Labeling of time points as in Figure 1 (a=min, b=max, g=30 minutes). Significance of the factor ‘ligation' on the levels of rCBF within each different time point was tested by multiple pairwise comparisons after two-way repeated measures analysis of variance: *P<0.05, **P<0.01, ***P<0.001. (#P<0.05) and (##P<0.01) indicate significant differences to time point ‘base' in each ligation group.

