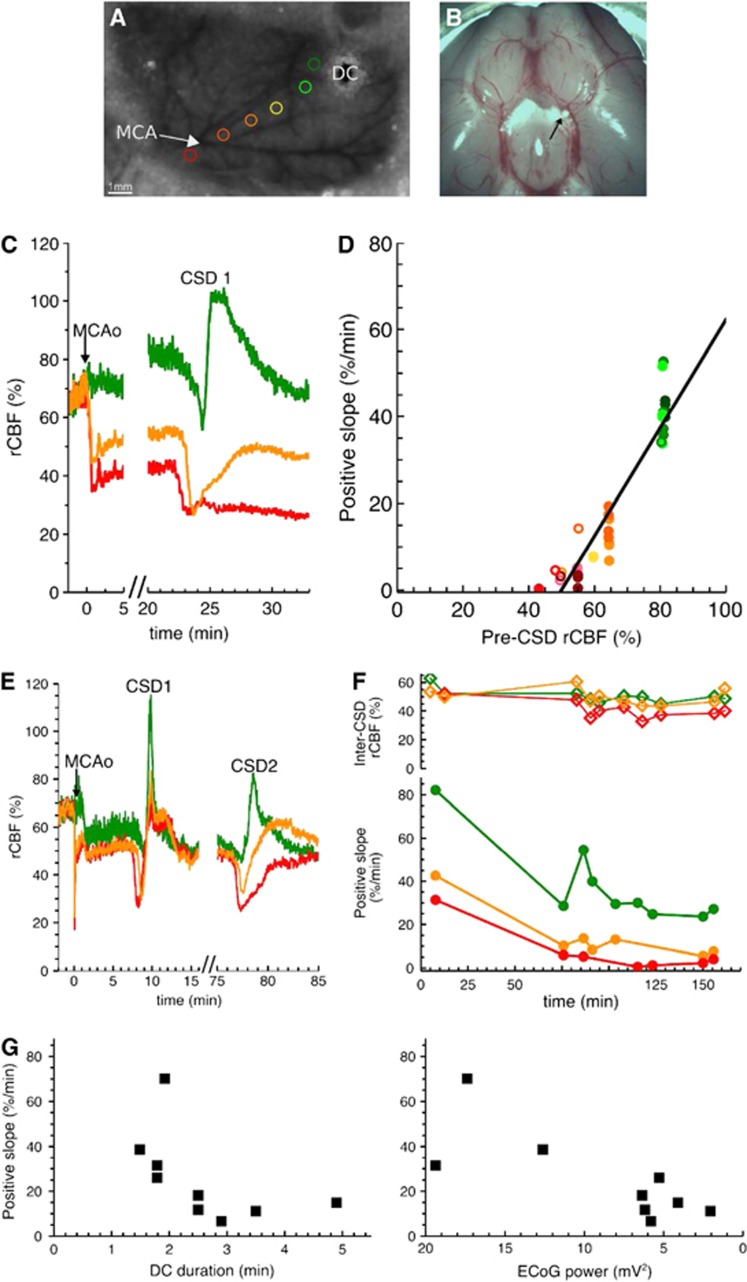
Figure 5.
Positive slope of regional cerebral blood flow (rCBF) response in experimental stroke model. (A) Typical laser speckle image of the left hemisphere through thinned skull prepared for middle cerebral artery occlusion (MCAo). Six regions of interest (ROIs) (colored circles) were placed along distal branches of the middle cerebral artery (MCA) (avoiding major blood vessels) at various distances relative to the ischemic focus (close to focus in red, far in green). A microelectrode (direct current (DC)) was also implanted in some animals, at various positions along the distal portion of the MCA. When rCBF waves hit the microelectrode, we observed a DC shift and a transient depolarization in the electrocorticogram (ECoG) activity, indicating that the rCBF waves were cortical spreading depolarization (CSD) events. (B) Postmortem examination of the location of the macrosphere (indicated by the black arrow). The macrosphere was typically trapped at the bifurcation of MCA and anterior cerebral artery. (C) Exemplar rCBF traces in three ROIs in animal 1 (same color code as in (A)). In this case, clear zonal rCBF gradients were observed immediately after occlusion. These rCBF gradients remained stable during the whole course of the experiment. Time 0 was defined as the time of occlusion (MCAo). Before occlusion, the common carotid artery (CCA) was ligated, so rCBF levels were of 66.5%. (D) Correlation between the positive slope of the rCBF response to CSD and the pre-CSD rCBF levels in animals 1 (closed symbol) and 2 (open symbol), where MCAo was induced under isoflurane. For each ROI (same color code as in (A)), rCBF (in between successive CSD waves) was stable over time (see C), and we defined the pre-CSD rCBF level as the average value of rCBF during 2 minutes before each CSD. We also calculated a positive slope for each CSD wave (see insert Figure 3D) in two animals. Parameters of the linear regression were as follows: y=1.24 × x−62.1, R2=0.87. (E) Exemplar rCBF traces in animal 3 (under propofol). After an hour gap following the first concentric CSD, circumferential CSD waves frequently propagated, so that the rCBF levels were highly influenced by the CSD waves. (F) Inter-CSD rCBF levels and positive slope over time (animal 3). Regional cerebral blood flow levels of different ROIs were similar (top) while the positive slope showed clear differences (bottom). The positive slope decreased with time, while rCBF remained quite stable. (G) Correlation of the positive slope with the electrophysiological variables measured with the microelectrode shown in (A) in animal 3. Direct current durations were calculated for each CSD wave as the width at half maximum. The ECoG power was calculated between successive CSDs. Note that the x-axis for the ECoG power is reversed, going from high power to low power values. The DC duration and the positive slope were negatively correlated, with decreasing positive slopes for increasing DC durations (Spearman rank order correlation: R=−0.78, P=0.00897). The power of the ECoG signal and the positive slope were positively correlated (Spearman rank order correlation: R=0.72, P=0.0248).

