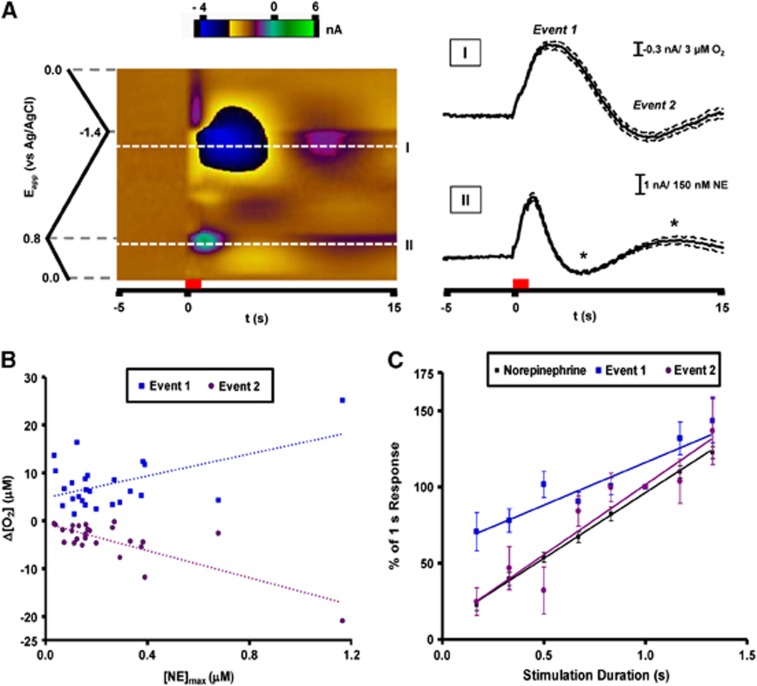
Figure 2.
Predominant O2 response recorded in the ventral bed nucleus of the stria terminalis with electrical stimulation of the ventral noradrenergic bundle. (A) Representative data averaged from 10 consecutive stimulations in a single animal. Current at all applied potentials is visualized in a false color display (left) with the stimulation time denoted by the red bar. Extracellular O2 is monitored at its reduction potential (−1.35 V, I). Current extracted from this potential reveals a biphasic O2 response after electrical stimulation. Norepinephrine release is simultaneously measured at its oxidation potential (+0.75 V, II) and is visible shortly after the stimulation onset. Changes in extracellular pH also generate current at this potential later in the recording (asterisks). Dashed lines indicate the s.e.m. for these measurements. (B) Magnitude of the O2 response compared with stimulated norepinephrine release across multiple animals (n=25). Both O2 events showed linear responses to the concentration of evoked norepinephrine (event 1: 11.46±3.90 μmol/L O2/μmol/L NE, r2=0.27; event 2: −14.20±2.37 μmol/L O2/μmol/L NE, r2=0.61). (C) Average peak amplitudes for norepinephrine and O2 as a function of stimulation pulse number (n=5, 10 to 80 pulses). Each data set is normalized to the 60 pulse response. Responses for O2 (event 1: r2=0.849; event 2: r2=0.895) and norepinephrine (r2=0.997) were linear within this pulse range.

