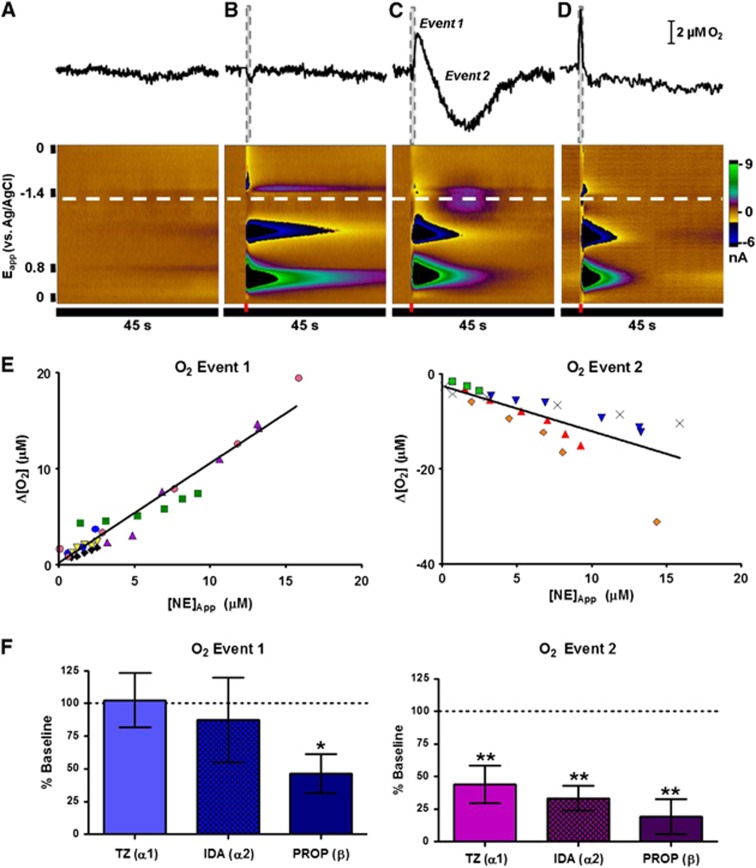
Figure 4.
O2 changes induced by direct delivery of norepinephrine with iontophoresis. (A–D) Example responses from a single recording location. Introduction of 4 μmol/L norepinephrine in vivo (C) evokes a biphasic O2 response that is not an artifact of natural activity (A) or vehicle (B, ejection of 4 μmol/L 4-methylcatechol). Iontophoresis of similar norepinephrine concentrations in the ventral bed nucleus of the stria terminalis in a brain slice does not induce O2 changes (D, 4 μmol/L ejection). The recording potential for O2 is indicated by the white dashed lines. Ejection times (1 second in duration) are denoted by the red and gray dashed bars. (E) Magnitude of O2 changes compared with the concentration of norepinephrine measured at the electrode. Data collected from the same recording location (average of 6 to 10 stimulations) are coded by point color and shape. (F) Effect of iontophoresed adrenoceptor antagonists terazosin (TZ, n=3), idazoxan (IDA, n=4) and propranolol (PROP, n=5)) on the O2 response. Significance was determined by a Dunnett's post hoc test after a one-way analysis of variance. *P<0.05, **P<0.01. IDA, idazoxan; PROP, propranolol; TZ, terazosin.

