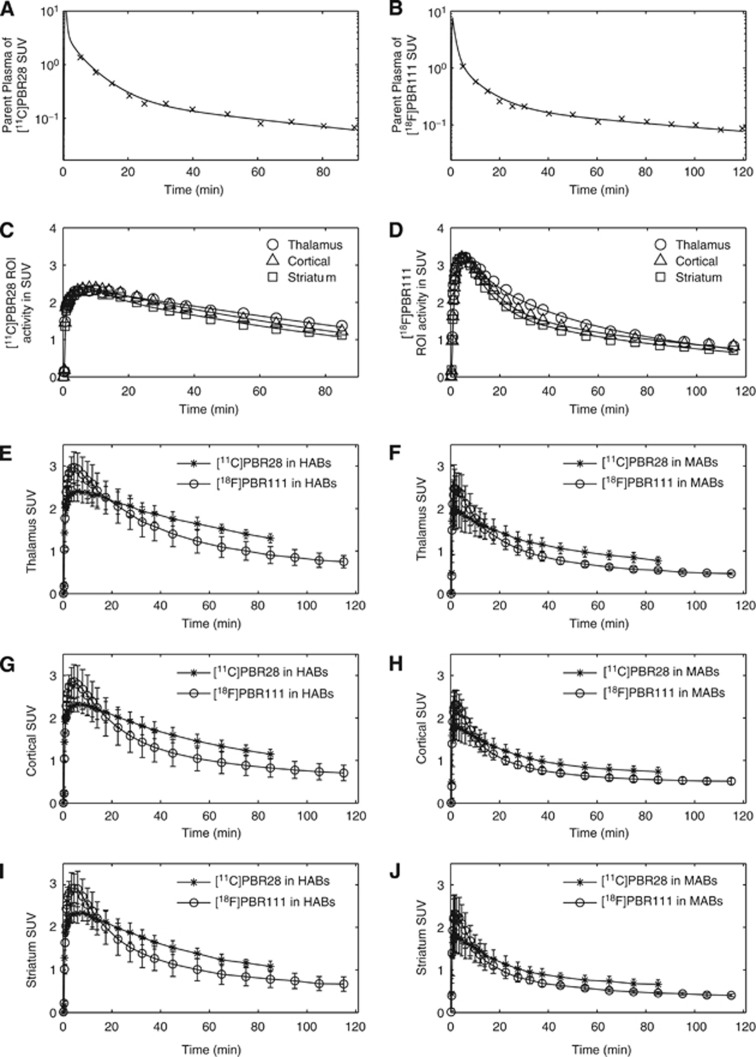
Figure 3.
Comparison of [11C]PBR28 and [18F]PBR111. (A) and (B): parent plasma input function in an HAB for the two ligands, respectively. (C) and (D): a two-tissue compartment model fit for the TACs in thalamus, cortical regions, and striatum in an HAB for the two ligands. (E)–(J): population TACs of [11C]PBR28 and [18F]PBR111 in HABs (left) and MABs (right) in the thalamus, cortical regions, and striatum. HAB, high-affinity binder; MAB, mixed-affinity binder; TAC, time-activity curve.

