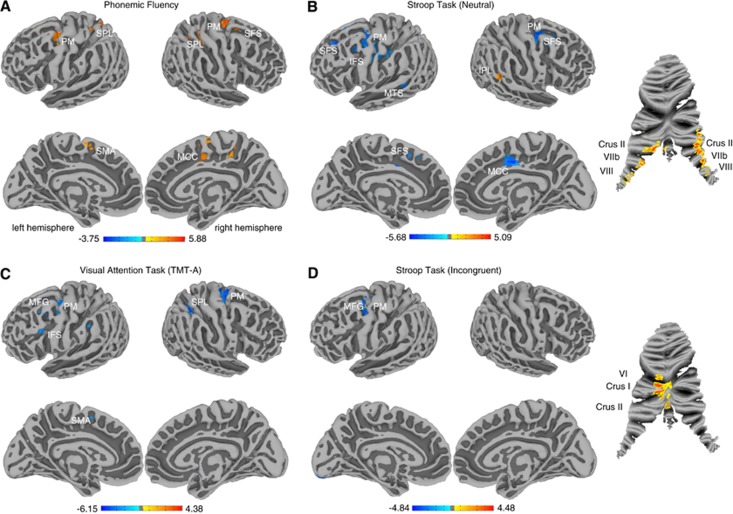
Figure 2.
Cerebral surface maps and cerebellar flat maps show significant correlations between task performance and centrality for tasks with significant group differences. Positive correlations are displayed in hot and negative correlations in cold colors (P<0.05, cluster corrected). (A) Correlation between centrality and number of words produced in a phonemic fluency task. Positive correlations are found in premotor (PM), posterior superior frontal sulcus (SFS), midcingulate cortex (MCC), supplementary motor area (SMA), and superior parietal lobe (SPL). (B) Correlation between centrality and reaction time in the neutral condition of the Stroop task. Negative correlations were found in PM, SFS, inferior frontal sulcus (IFS), middle temporal sulcus (MTS), and MCC. Positive correlations were found in Crus II, VIIb, and VIII of the cerebellum and the inferior parietal lobe (IPL). (C) Correlation between centrality and time needed to complete a visual attention task (TMT-A—Trail-Making-Test part A). Negative correlations were found in PM, middle frontal gyrus (MFG), supplementary motor area (SMA), SPL, and IFS. (D) Correlation between centrality and reaction time in the incongruent condition of the Stroop task. Negative correlations were found in PM/posterior MFG. Positive correlations were found in VI, Crus I and II of the cerebellum.

