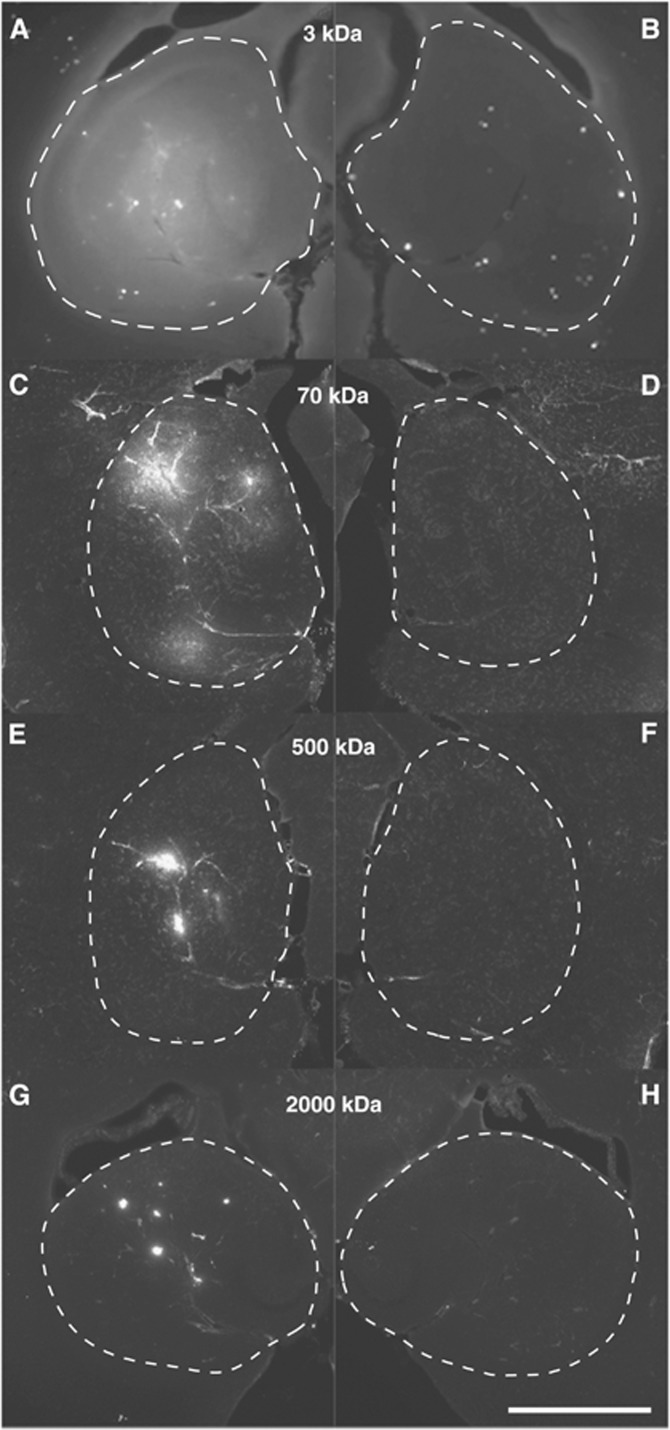
Figure 2.
Horizontal sections of the left (sonicated) and right (nonsonicated) hippocampal regions of four mouse brains injected with different-size dextrans: (A, B) 3 kDa, (C, D) 70 kDa, (E, F) 500 kDa, and (G, H) 2,000 kDa. The dash lines highlight the boundaries of the hippocampal regions. The ultrasound pressure was 0.84 MPa for the four cases. These images show that higher amounts and larger areas of dextran delivery were achieved for smaller-size dextrans. The scale bar represents 1 mm.

