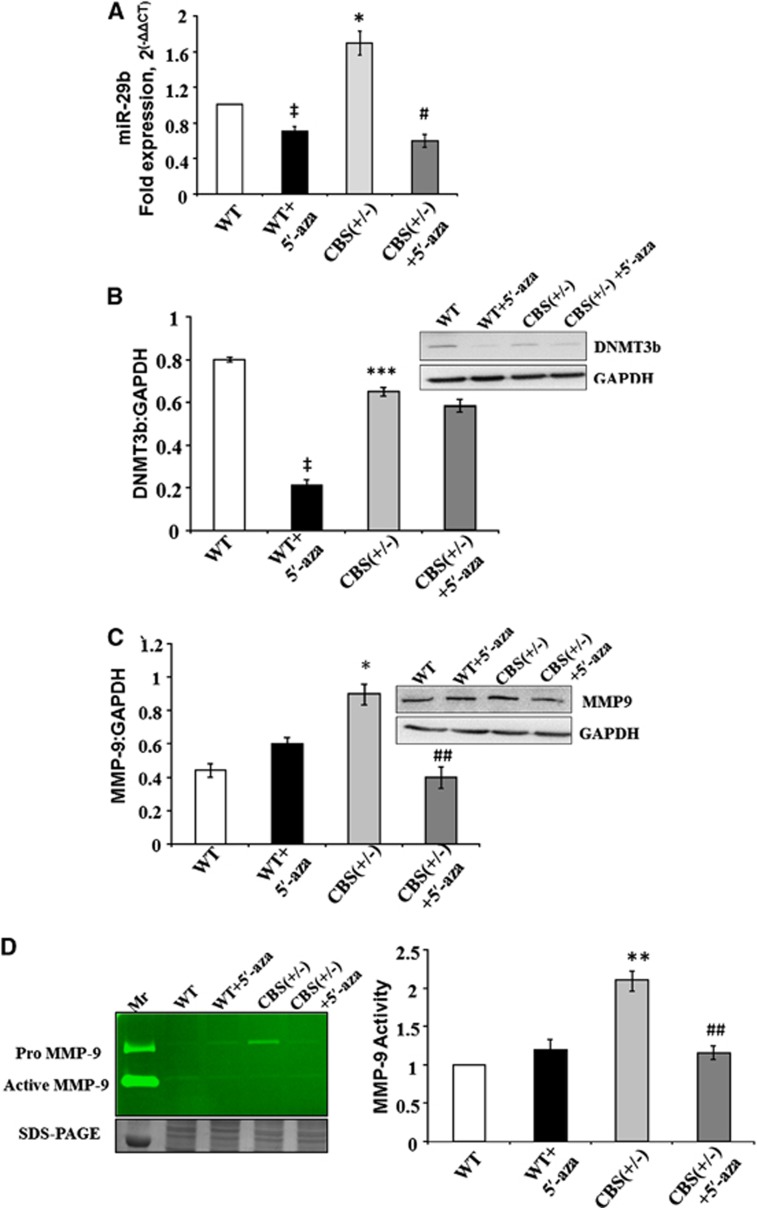
Figure 6.
The regulation of miR29, DNMT3b, and MMP9 in mice brain tissues. (A) Bar graph showing qPCR analysis for miR29b in wild type (WT), WT+5′-aza (5′-azacytidine), cystathionine-beta-synthase deficient (CBS+/−), and CBS+/−+5′-aza mice groups. (B) Representative western blot image and bar graph showing DNMT3b expression in different mice groups. Glyceraldehyde 3-phosphate dehydrogenase (western blot) and 18sRNA (qPCR) were used as normalization control. (C) Representative western blot image and bar graph showing MMP9 expression in different mice groups. Glyceraldehyde 3-phosphate dehydrogenase was used as normalization control. (D) Representative gelatin zymography image for MMP9 activity in different mice groups. The loading of the protein sample per lane is confirmed by sodium dodecyl sulfate polyacrylamide gel electrophoresis bands given at the bottom of gelatin zymograph image. The MMP9 activity results are also expressed in bar diagram. Data represent mean±s.e.m. ‡P<0.05 versus WT group; *P<0.05, **P<0.005, ***P<0.0005 versus WT and WT+5′-aza groups; #P<0.05, ##P<0.005 versus CBS+/− groups; data analyzed from four independent experiments (n=4).

