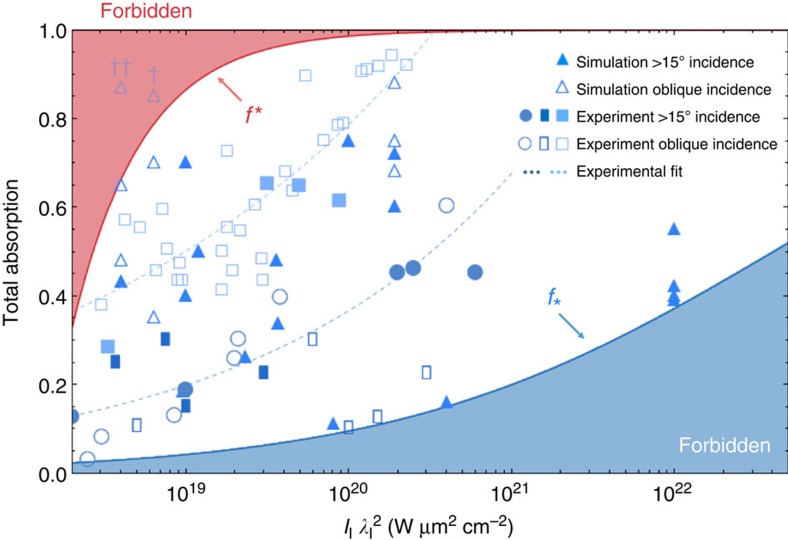
Figure 3. Comparison between absorption bounds and published data.
The complete data set compiled in Davies49 is reproduced here, spanning experimental and simulation data published over the past two decades, across a variety of laser and plasma conditions. Dashed lines corresponding to fits of selected experimental data are shown to guide the eye. Additional high-intensity simulation data are reproduced from Levy et al.48 The upper limit on absorption f* is depicted in red and the lower limit f* in blue, with forbidden regions indicated using shading. The two outlying data points correspond to simulations of (†) a very thin 0.2 μm pre-deformed target, and (††) an essentially underdense nc > n0 interaction, both violating assumptions underpinning the laser-solid model (see Methods).

