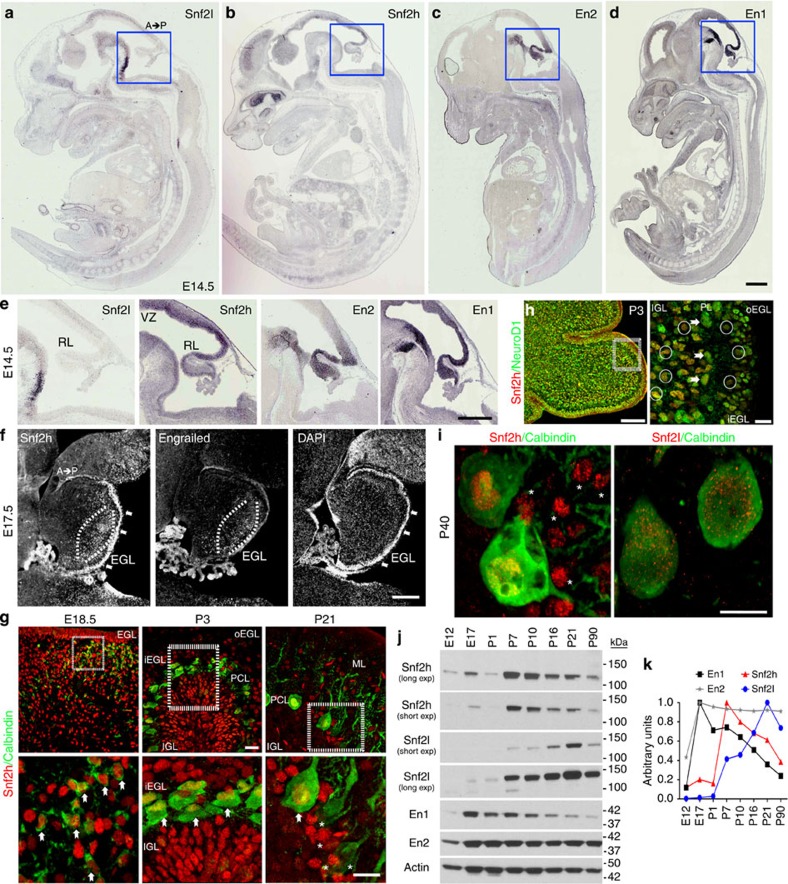
Figure 1. Snf2h and Snf2l are dynamically regulated in the developing cerebellum.
(a–d) In situ hybridization for Snf2l, Snf2h, En2 and En1 from wild-type (WT) embryonic (E) 14.5 sagittal sections adapted from Genepaint.org70. Scale bar, 500 μm. (e) Boxed areas from a–d highlight the robust expression of Snf2h, En2 and En1 within the developing rhombic lip, while Snf2l is not detectable. A, anterior; P, posterior. Scale bar, 200 μm. (f) E17.5 WT sagittal cerebellar sections serially immunolabelled with Snf2h and Pan-Engrailed (En) antibodies. Brackets highlight regions of robust Snf2h and Engrailed immunoreactivity (−ir). Arrows denote robust Snf2h-ir within the EGL. DAPI labels all nuclei. Scale bar, 200 μm. (g) Confocal Z-stacks through the WT cerebellar vermis co-labelled with Snf2h (red) and Calbindin (green), a marker of the PC lineage at the indicated ages. Boxed areas are enlarged at bottom. Arrows denote Snf2h+ PCs. Asterisks denote Snf2h+ interneurons at P21. EGL, external granule layer; IGL, internal granule layer; PCL, Purkinje cell layer; o, outer; i, inner. Scale bars, 20 μm (top panels); 10 μm (bottom panels). (h) Confocal Z-stacks through the WT cerebellar vermis at post-natal day 3 (P3) co-labelled with Snf2h (red) and NeuroD1 (green), a marker of differentiated neurons. Arrows denote NeuroD1+, Snf2h+ PCs, as distinguished by their nuclear size and laminar position. Circles denote NeuroD1+, Snf2h+ granule cells (GCs) within the iEGL and the IGL. Scale bar, 20 μm. (i) Confocal Z-stacks through the P40 WT cerebellar vermis co-labelled with calbindin (green) and Snf2h (red, left panel); or Snf2l (red, right panel). Asterisks denote Snf2h+ interneurons. Scale bar, 5 μm. At least three mice from each genotype were used for evaluation. (j) Snf2h, Snf2l, En1 and En2 immunoblots of WT cerebellar extracts, except for E12 and E17 where hindbrain extracts were used. Actin served as loading control. (k) Plot of relative Snf2h, Snf2l, En1 or En2 expression during cerebellar development. The peak expression for each protein was normalized to 1, n=3.

