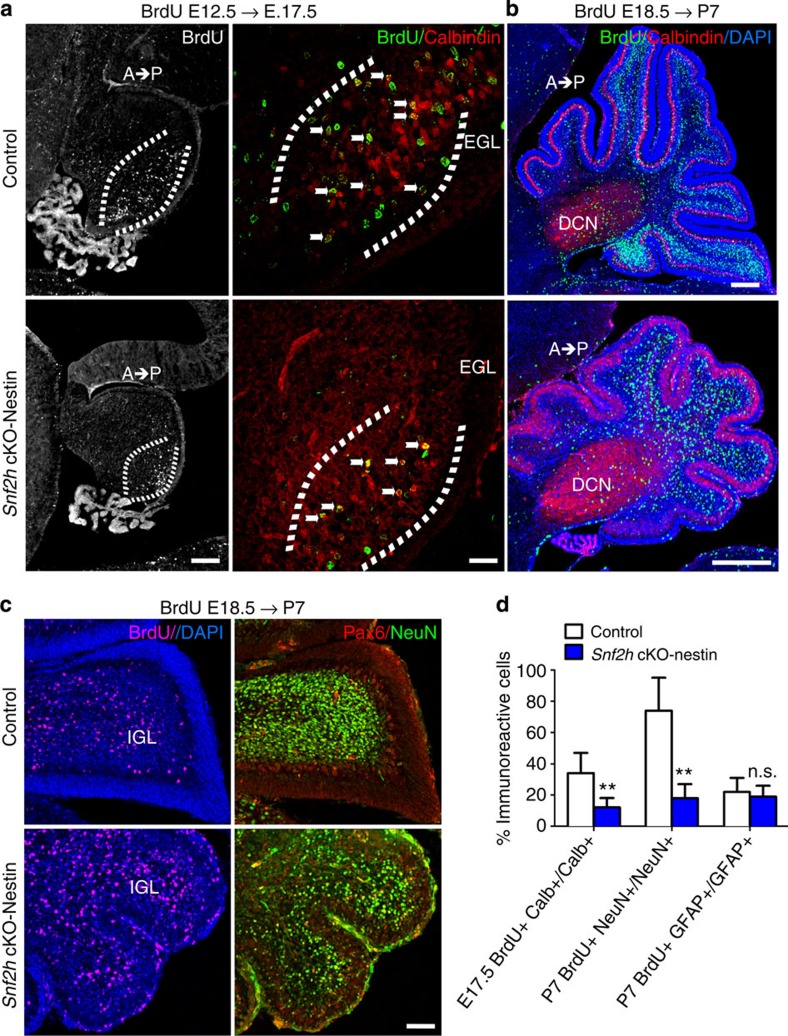
Figure 4. Snf2h loss affects PC and GNP expansion resulting in cerebellar hypoplasia.
(a) Confocal Z-stacks from Snf2h cKO-Nes and control littermates that were BrdU-birthdated at E12.5, a time of PC birth, and co-labelled for BrdU (green) and Calbindin (red) at E17.5 (brackets). Note the reduction of BrdU+, Clabindin+PCs in mutant embryos (arrows). Scale bar, 50 μm. (b) Confocal Z-stacks from Snf2h cKO-Nes and control littermates that were BrdU-birthdated at E18.5, a time of robust GNP expansion, and co-labelled for BrdU (green) and Calbindin (red) at P7. DAPI (blue) stains all nuclei. Note the spatiotemporal (anterior low, posterior high) distribution of BrdU+ GCs throughout the internal granule layer in control cerebella that is altered in mutant brains. DCN, deep cerebellar nuclei. Scale bar, 100 μm. (c) Confocal Z-stacks through the cerebellar vermis from Snf2h cKO-Nes and control littermates that were BrdU-birthdated at E18.5, and labelled for BrdU (magenta); or co-labelled for Pax6 (red) and NeuN (green) at P7. DAPI (blue) stains all nuclei. Scale bar, 50 μm. At least three mice from each genotype were used for evaluation. (d) Quantification of double-labelled BrdU+ and Calbindin+ PCs at E17.5 (E12.5 BrdU birthdating); double-labelled BrdU+ and NeuN+ GCs at P7 (E18.5 BrdU-birthdating); or double-labelled BrdU+ and GFAP+ glial cells from mutant and control mice at P7 (E18.5 BrdU-birthdating). **P<0.01, Student’s t-test. n.s., not significant, n=3. Values are presented as the mean±s.e.m.

