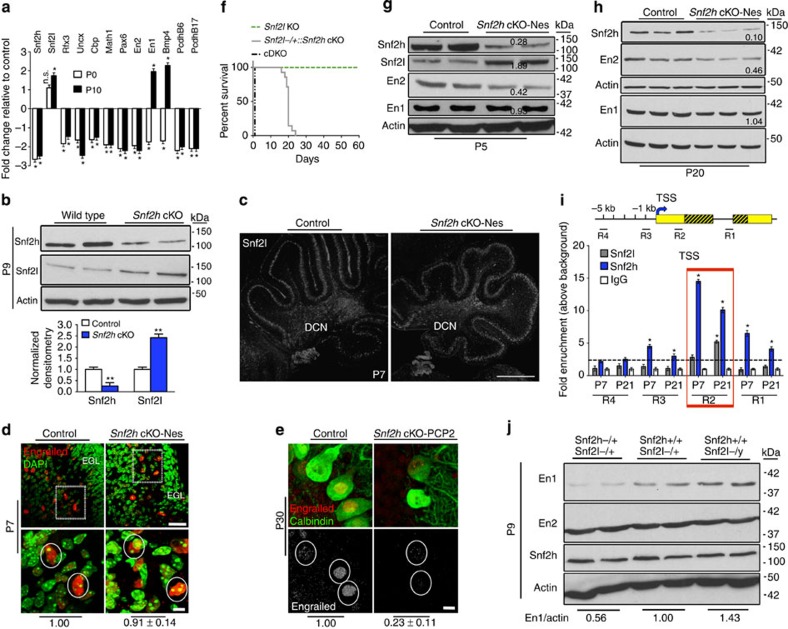
Figure 6. Snf2h and Snf2l co-modulate the En1 locus.
(a) RT–qPCR analysis of selected genes from Snf2h cKO-Nes and control cerebella at P0 and P10. *P<0.05, Student’s t-test. n.s., not significant, n=6 from one of two independent experiments. (b) Immunoblots for Snf2h and Snf2l from Snf2h cKO-Nes and control cerebellar extracts at P9. Graph below depicts quantification for Snf2h and Snf2l, normalized to actin. **P<0.01, Student’s t-test, n=3. Values are presented as the mean±s.e.m. (c,d) Confocal Z-stacks of P7 cerebellum from Snf2h cKO-Nes and controls immunolabelled for (c) Snf2l. DCN, deep cerebellar nuclei. Scale bar, 200 μm; or (d) Pan-Engrailed (red) and counterstained with DAPI (green). Boxed areas are enlarged at bottom and denote similar En immunoreactivity in cells from both genotypes. Scale bars, 50 μm (top); 10 μm (bottom). (e) Confocal Z-stacks of P30 cerebellum from Snf2h cKO-PCP2 and controls immunolabelled with Pan-Engrailed (red) and Calbindin (green). Engrailed images in bottom panel are pseudocolored (silver) for contrast. Scale bar, 5 μm. Values (d,e) denote Engrailed immunopixels normalized to WT within cells with a nuclear size >10 μm2 (circles). At least 50 PCs from three independent mice were quantified per genotype. (f) Kaplan–Meier curves of Snf2l KO, Snf2l−/+::Snf2h cKO-Nes and cDKO-Nes mice. Note that one Snf2l allele in a Snf2h-null background rescues the lethality of cDKO-Nes mice up to ~P25 (n=25). (g,h) Immunoblots for Snf2l, Snf2h, En2 and En1 from Snf2h cKO-Nes and control cerebellar extracts at P5 (g) and P20 (h). Actin served as loading control. Values denote averaged densitometry (n=4). (i) Top: schematic diagram of the mouse En1 locus indicating primer set locations. Yellow boxes, 5′ and 3′ untranslated regions (UTRs); striped yellow boxes, coding region; black line=non-coding region; TSS, transcription start site (arrow); kb, kilobases away from the TSS (+1). Bottom: ChIP-qPCR from WT cerebellar extracts for the En1 locus reveals Snf2h enrichment throughout the gene (R3, R2 and R1) at P7 and P21. Snf2l enrichment occurs only in the 5′-UTR (R2) at P21. *P<0.05, Student’s t-test, n=4 from one of three independent experiments. Values are presented as the mean±s.e.m. (j) Immunoblots for Snf2h, En2 and En1 from Snf2h+/+::Snf2l−/+ (WT); Snf2h−/+::Snf2l−/+ (Snf2h heterozygote); or Snf2h+/+::Snf2l−/y (Snf2l KO) cerebellar extracts at P9. Values denote averaged densitometry relative to WT levels (n=4).

