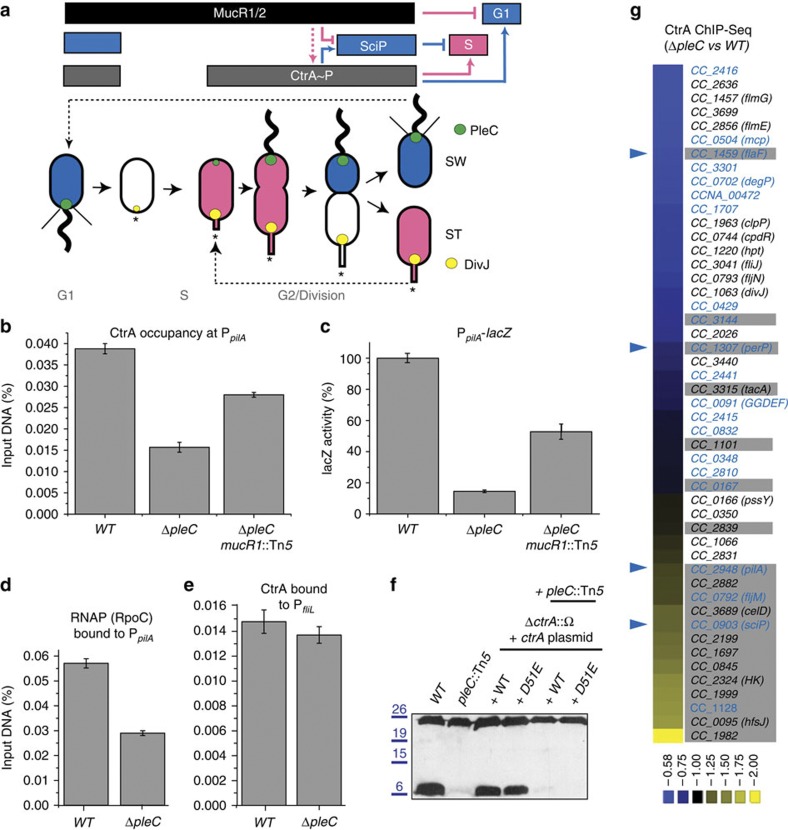
Figure 1. CtrA-bound promoters that are affected in ΔpleC cells.
(a) Schematic of the regulatory interactions between ctrA, sciP and mucR1 and mucR2 (mucR1/2) during the C. crescentus cell cycle. Phosphorylated CtrA (CtrA~P) activates transcription of S- and G1-phase genes. In S-phase, MucR1/2 represses G1-genes such as sciP. The sciP gene is activated in G1 and the newly synthesized SciP translation product represses S-phase promoters. The antagonistic kinase/phosphatase pair, DivJ (yellow dot) and PleC (green dot) indirectly influence CtrA~P and partition with the stalked (ST) cell chamber or swarmer (SW) cell chamber, respectively. PleC promotes CtrA~P accumulation in the SW cell. The dashed arrow indicates that MucR1/2 promote expression of CtrA, but not necessarily its phosphorylation. The star denotes the holdfast. Blue colouring denotes G1-phase transcription, whereas pink is for the late S-phase programme. Light grey labels indicate the cell cycle stages. (b–e) Occupancy of CtrA and RNA polymerase (RNAP) at the pilA (PpilA) and fliL promoter (PfliL)) in WT (NA1000), ΔpleC and ΔpleC mucR1::Tn5 mutant cells as determined by quantitative chromatin immunoprecipitation assays (qChIP) using antibodies to CtrA or RpoC, as well as pilA transcription measurements conducted using a PpilA-lacZ promoter-probe reporter. Data are from three biological replicates. Error is shown as s.d. (f) Immunoblots showing PilA (lower band, approximately 6 kDa) and CtrA (upper band, approximately 26 kDa) steady-state levels in WT and pleC::Tn5 mutant cells harbouring WT ctrA or phosphomimetic ctrA(D51E) expressed from a plasmid in the absence of chromosomally encoded CtrA (ΔctrA::Ω). Molecular size standards are indicated on the left as blue lines with the corresponding values (blue) in kDa. (g) Comparative ChIP-seq performed with antibodies to CtrA on chromatin from WT and ΔpleC cells. Boxed in grey are PleC:CtrA promoters that were verified as being PleC dependent (Supplementary Fig. 1B). Blue labels indicate PleC:CtrA promoters that are bound by MucR1/2 as determined by the ChIP-seq experiments (Fig. 2). Blue arrowheads point to promoters for which the ChIP-seq traces are shown in Fig. 5. The colour key at the bottom indicates the degree by which the occupancy of CtrA is altered by the ΔpleC mutation, expressed as log2 ratio (Supplementary Data 1).

