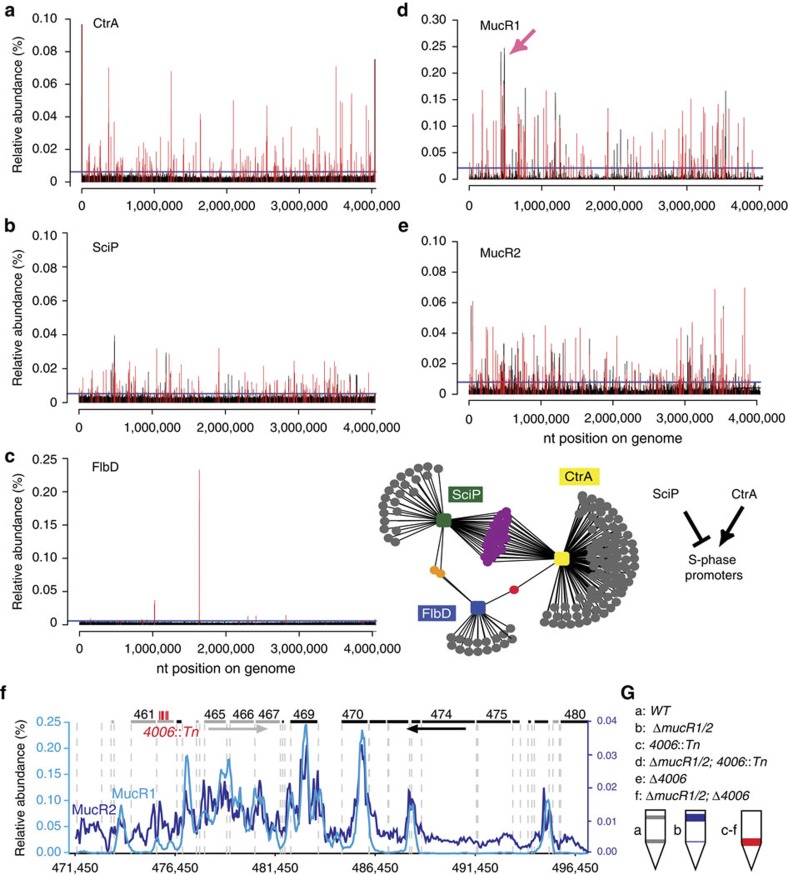
Figure 2. Genome-wide occupancy of CtrA, SciP, FlbD, MucR1 and MucR2.
(a–e). Genome-wide occupancies of CtrA (a), SciP (b), FlbD (c), MucR1 (d) and MucR2 (e) on the C. crescentus genome as determined by ChIP-seq. Note that owing to the ability of the anti-MucR2 antibody to precipitate MucR1, some of the peaks in e could also derive from MucR1, but this is also expected as we show in Fig. 4a that MucR1 can interact with MucR2. The x axis represents the nucleotide position on the genome, whereas the y axis denotes the relative abundance of reads for each probe (see Supplementary Methods for detailed description). Candidate peaks reported in each profile are shown as red bars (‘ANNO probes’; Supplementary Data 1–5), whereas a horizontal blue line in each profile denotes the cutoff applied to separate peaks and background. The middle panel in c depicts the minimal overlap between the targets of SciP, CtrA and FlbD, whereas the right panel illustrates the regulatory relationship between SciP, CtrA and S-phase promoters. The pink arrow in d denotes the 26-kb mobile genetic element (MGE) enlarged in f. (f) ChIP-seq trace of MucR1 (light blue) and MucR2 (dark blue) on the 26-kb MGE. Genes encoded from right to left are shown in grey bars, whereas the black bars indicate genes on the reverse strand. The numbers above refer to the CCNA gene annotation. The himar1 (Tn) insertions in CCNA_04006 are shown as vertical red bars. (g) Buoyancy of WT (grey) and mutant (blue or red) cells harbouring a himar1 (Tn) insertion or an in-frame deletion (Δ) in CCNA_04006 (4006). The schematic shows the sedimentation of cells after Percoll density gradient centrifugation in a test tube. Although WT cells show the typical upper and lower buoyancy conferred by S and G1 cells, respectively, ΔmucR1/2 cells only show the former. CCNA_04006 is epistatic over mucR1/2, as inactivation CCNA_04006 confers the latter buoyancy.

