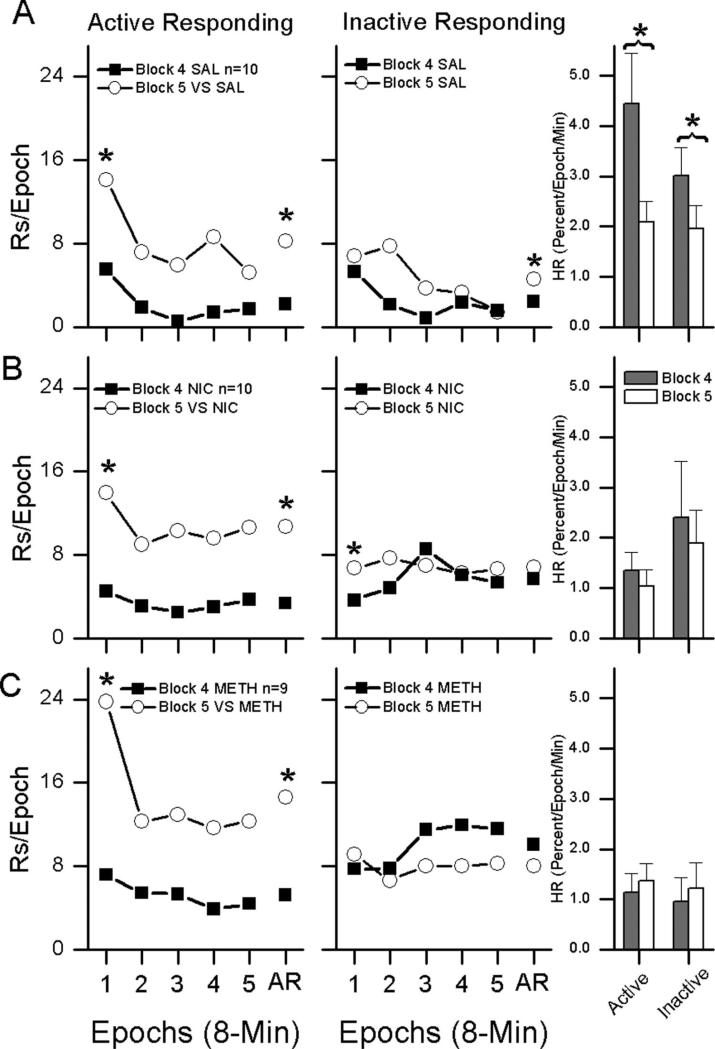
Figure 3.
Effects of response-contingent light-onset on habituation rate and responding were compared with habituation rate and responding during Block 4 of the Drug Alone phase. The left column of Figure 3 shows within-session active responding during the Operant Level phase plotted in 8-min epochs. The middle column of Figure 3 shows within-session inactive responding during the Operant Level phase plotted in 8-min epochs. The right column shows habituation rate. The top row (A) shows results from saline (SAL)-treated rats, the middle row (B) shows results from nicotine (NIC, 0.4 mg/kg)-treated rats, and the bottom row (C) shows results from methamphetamine (METH, 0.75 mg/kg)-treated rats. Asterisks indicate significant p < .05.

