
Figure 3.
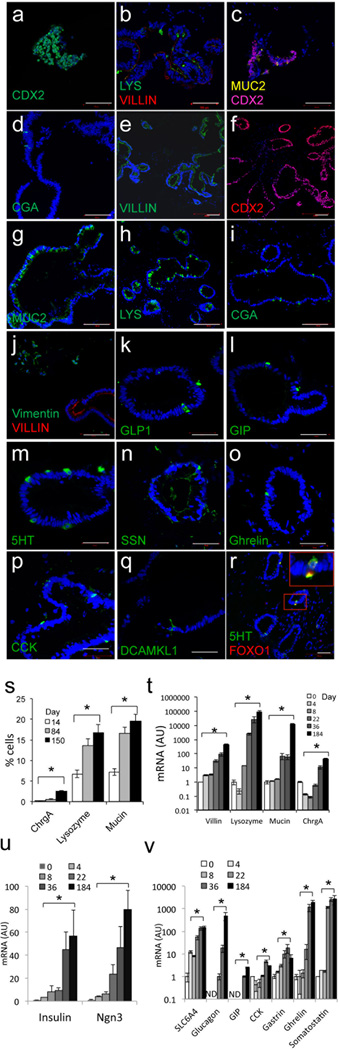
Marker analysis of 150-day-old human iPS-derived gut organoids. a, CDX2 (green) in 8-day-old organoids; b, LYS (green) and VILLIN (red); c, MUC2 (yellow) and CDX2 (magenta); d, CGA (green) in 14-day-old organoids by immunohistochemistry. e, Villin; f, CDX2; g, MUC2; h, LYS; i, CGA; j; vimentin (green) and VILLIN (red) in 150-day-old gut organoids.. k–r, Analysis of endocrine cells; GLP1, GIP, 5HT, SSN, ghrelin, cholecystokinin (CCK), tuft cells (DCAMKL1), FOXO1 (green) and 5HT (red) in 150-day-old organoids. s, Quantification of CGA-, LYS- and MUC2-positive cells by immunohistochemistry. t–u, Time course qPCR analysis of VILLIN, LYSOZYME, MUCIN2 and CGA (t); INSULIN and NEUROG3 (u); SLC6A4 (serotonin transporter), GLUCAGON, GIP, CCK, GASTRIN, GHRELIN, and SSN during gut differentiation. Scale bars: 100 µm in panels a–j; 50 µm in panels k–r (n=3 each for histology and qPCR) (*p < 0.05). We present data as means ± SEM.