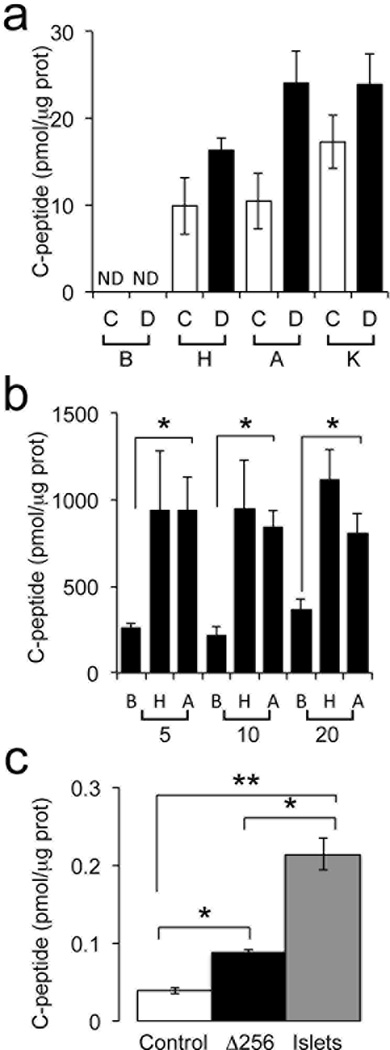
Figure 8.

Human C-peptide assay using 200-day-old human gut organoids and pancreatic islets. a, Human C-peptide release from gut organoids normalized by protein levels in organoid lysates. C: control adenovirus; D: HA-Δ256 FOXO1 adenovirus, B: basal glucose (2 mM); H: high glucose (22mM); A: arginine (10 mM); K: KCl (30 mM); ND: not detected. b, C-peptide secretion by human islets. Abbreviations are the same as in panel a. The numbers below the brackets refer to number of islets used. c, C-peptide content in gut organoids and human islets *p < 0.05 vs. organoids transduced with control virus (panel c) or basal vs. glucose- and arginine-stimulated conditions (panel b) (** p < 0.05 vs. human islets in panel c). We present data as means ± SEM (n = 3).
