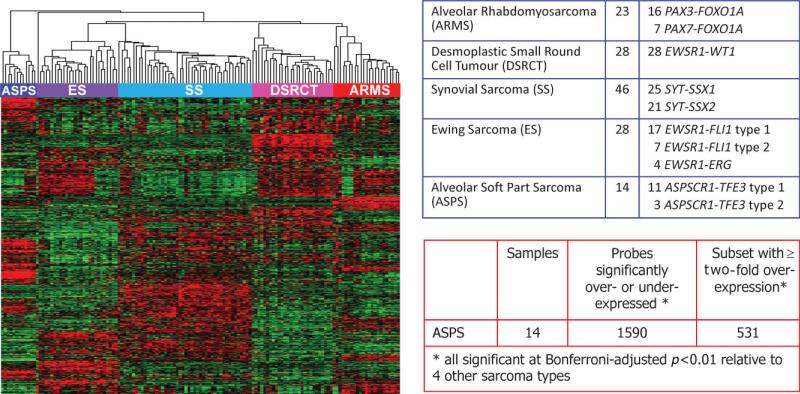
Figure 2.
Expression profiling data set on 139 sarcomas with chimeric TFs using Affymetrix U133A microarrays. Left panel shows unsupervised clustering of the expression data, demonstrating complete separation of the five sarcoma types in the dataset. The five sarcoma types and the corresponding gene fusions documented in all the cases are listed in the top right table. The bottom left table shows the analysis for differentially expressed genes in ASPS samples, all of which contained the ASPCR1–TFE3 fusion

