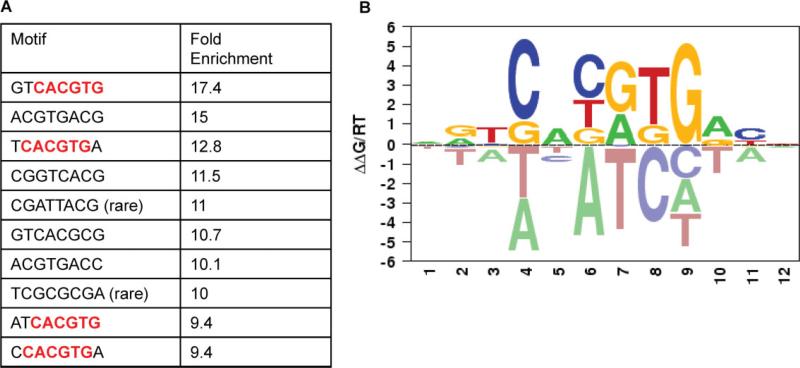
Figure 5.
A. An analysis of over-represented 8 bp sequences in promoter regions bound by ASPSCR1–TFE3 rediscovered the CACGTG binding sequence which was previously described for TFE3, present here in four of the 10 top-scoring 8 bp motifs (boldface, red). In addition, it appeared to favour a 5'T and a 3'A. (B) Using MatrixREDUCE analysis, again the CACGTG consensus binding sequence was identified and favoured 5'T and 3'A. In this data visualization, the size and vertical order of the bases above the horizontal axis indicates the consensus and its strength at that position (see text for details)

