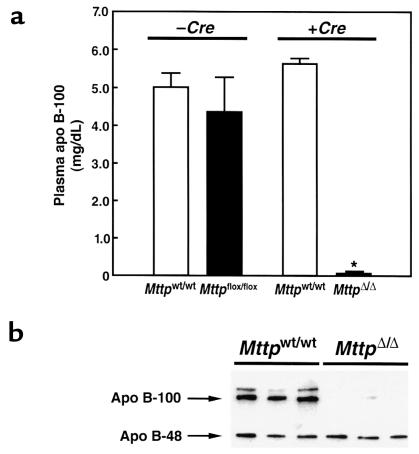
Figure 4.
Plasma apo B levels in Mttpwt/wt and MttpΔ/Δ mice. (a) Bar graphs illustrating apo B-100 concentrations (means ± SD) in the plasma of Mttpwt/wt/Mx1-Cre and Mttpflox/flox/Mx1-Cre mice, both before and after pIpC induction of Cre expression. Apo B-100 concentrations were assessed with an mAb-based RIA. (b) Analysis of plasma apo B levels in MttpΔ/Δ mice (Mttpflox/flox/Mx1-Cre mice treated with pIpC), as judged by Western blots of SDS-polyacrylamide gels. Plasma samples (obtained after a 4-hour fast) were size-fractionated on a 4% SDS-polyacrylamide gel, and Western blots were performed with a rabbit antiserum specific for mouse apo B (35).

