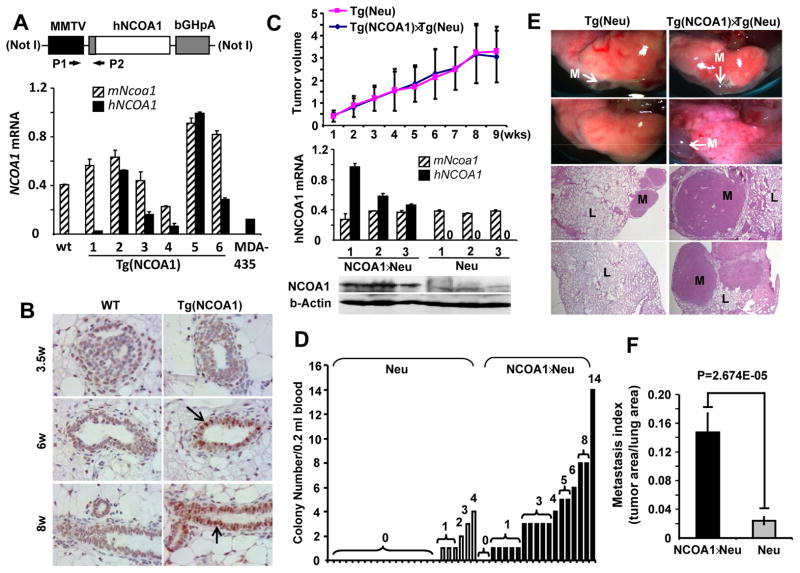
Fig. 1. Generation of Tg(NCOA1) mice and mammary tumor metastasis in Tg(Neu) (Neu) and Tg(NCOA1)×Tg(Neu) (NCOA1×Neu) mice.
A. The MMTV-hNCOA1 transgene and qPCR analysis of hNCOA1 mRNA expression. RNA was extracted from MGs of WT and Tg(NCOA1) mice and MDA-MB-435 cells. qPCR was performed using hNCOA1 cDNA-specific P1/P2 primers. Human (hNCOA1) and mouse (mNcoa1) are indicated. bGHpA, bovine growth hormone polyadenylation sequence. B. IHC was performed using an antibody that detects both mNcoa1 and hNCOA1. Arrows indicate NCOA1-overexpressing mammary epithelial cells. MG sections were prepared from female WT and Tg(NCOA1) mice with indicated weeks of ages. C. Tumor growth curves were obtained from 27 Tg(Neu) and 26 Tg(NCOA1)×Tg(Neu) mice by measuring tumor volumes (cm3). Tumor specimens were collected at 9 weeks after mammary tumors were palpated and subjected to Western blotting using a NCOA1 antibody that recognizes both hNCOA1 and mNcoa1. β-actin served as a loading control. Three tumors from each genotype group were assayed. D. The number of tumor cell colonies derived from circulating tumor cells in the blood samples of Tg(Neu) and Tg(NCOA1)×Tg(Neu) mice that had developed mammary tumors for 9 weeks. Student’s T test indicates a significant difference (p=0.001) between the two groups. E. Metastatic tumor foci on the lung surfaces and H&E-stained lung (L) sections with metastatic (M) tumors in Tg(Neu) and Tg(NCOA1)×Tg(Neu) mice. F. Lung metastasis indexes are presented as the ratio of tumor area to the total tumor and lung area in Tg(Neu) (n=15) and Tg(NCOA1)×Tg(Neu) (n=10) mice.

