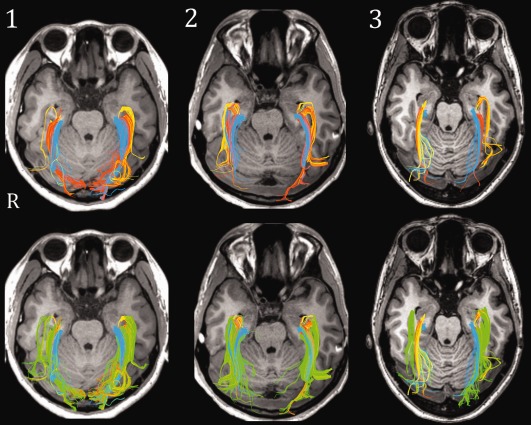
Figure 7.

Results from initial tractography of white matter regions bordering LGN (three exemplary participants) displayed axially. Top: streamlines seeded from LGN ROI two (yellow); three (orange), and five (blue). Bottom: same data, with streamlines seeded from region four (green) overlaid. Note the correspondence between green streamlines with those seeded from other ROI (particularly anterior and middle streamlines).
