
Figure 8.
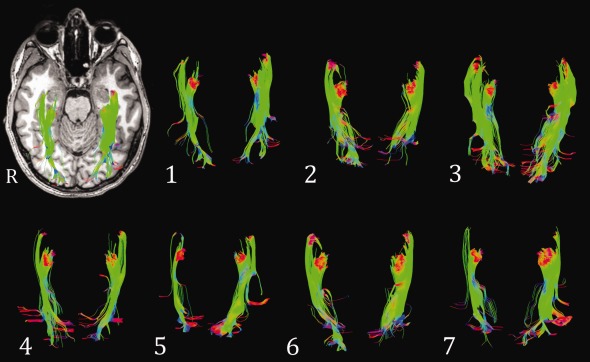
Final tractography results. These represent the optic radiations seeded from LGN ROI 2–5 (axial view) of each participant. Results from 14 hemispheres (seven participants). Top left: data from Participant 1 overlaid on their T1 image.
Official websites use .gov
A
.gov website belongs to an official
government organization in the United States.
Secure .gov websites use HTTPS
A lock (
) or https:// means you've safely
connected to the .gov website. Share sensitive
information only on official, secure websites.
Final tractography results. These represent the optic radiations seeded from LGN ROI 2–5 (axial view) of each participant. Results from 14 hemispheres (seven participants). Top left: data from Participant 1 overlaid on their T1 image.