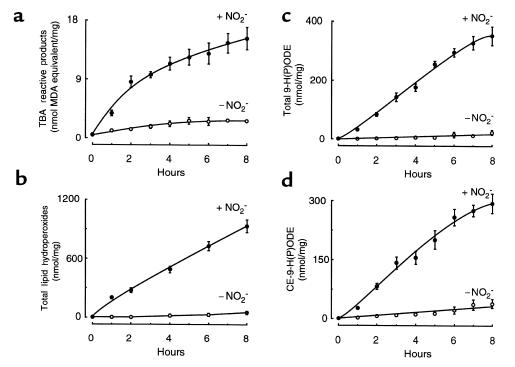
Figure 7.
Quantification of multiple lipid oxidation products formed during LDL modification by the MPO-H2O2-NO2– system. LDL samples prepared for Figure 5 were analyzed for TBA reactive products (a), total lipid hydroperoxides (b), total 9-H(P)ODE (c), and cholesteryl-9-H(P)ODE (d) as described in Methods. Data represent the mean ± SD of 3 independent experiments (1 using [125I]LDL as starting material and 2 using nonlabeled LDL as starting material). + NO2– (filled circles), LDL modified by MPO, an H2O2-generating system (GGOx), and NO2– as described in Figure 5; – NO2– (open circles), LDL modified by MPO and an H2O2-generating system (GGOx) as described in Figure 5.

