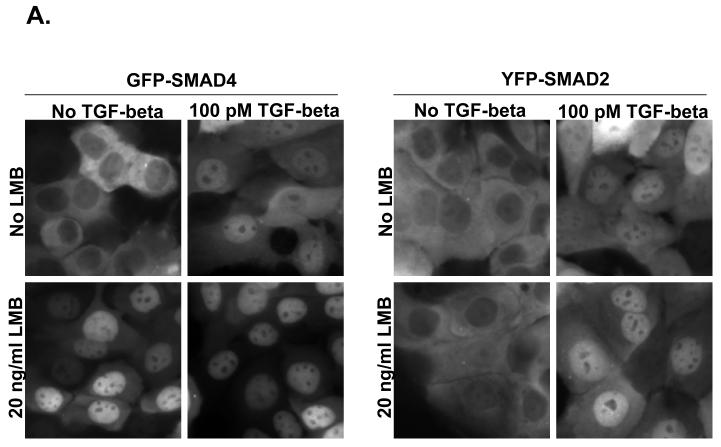
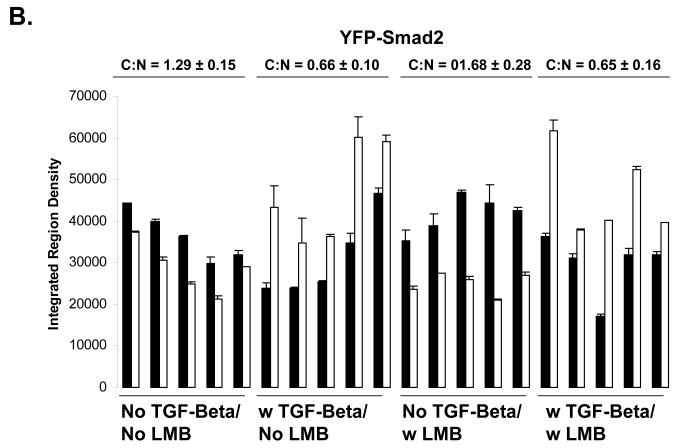
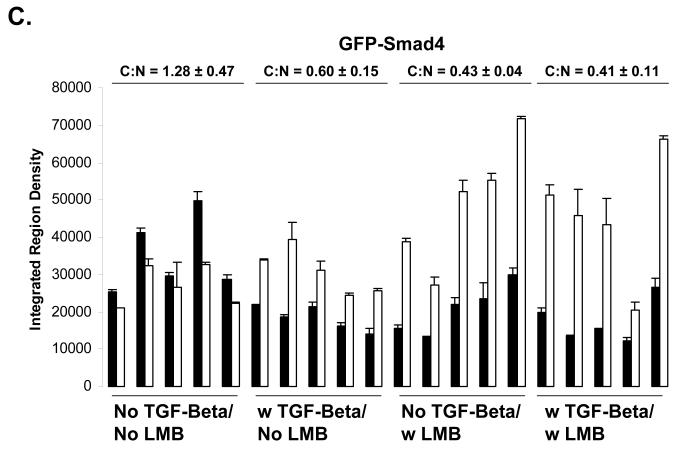
Figure 3.
A) Live Cell Imaging of GFP-Smad4 and YFP-Smad2. HaCaT cells expressing either N-terminally tagged GFP Smad4 or N-terminally tagged YFP Smad2 were imaged to determine the relative localization of GFP-Smad4 or YFP Smad2. B) Quantification of fluorescent images for YFP-Smad2, and GFP-Smad4 (C). Black bars indicate cytoplasm fluorescence intensity, while white bars indicate nuclear fluorescent intensity. Error bars indicate one standard deviation for the two measurements made for each cell.


