
Figure 76.1.
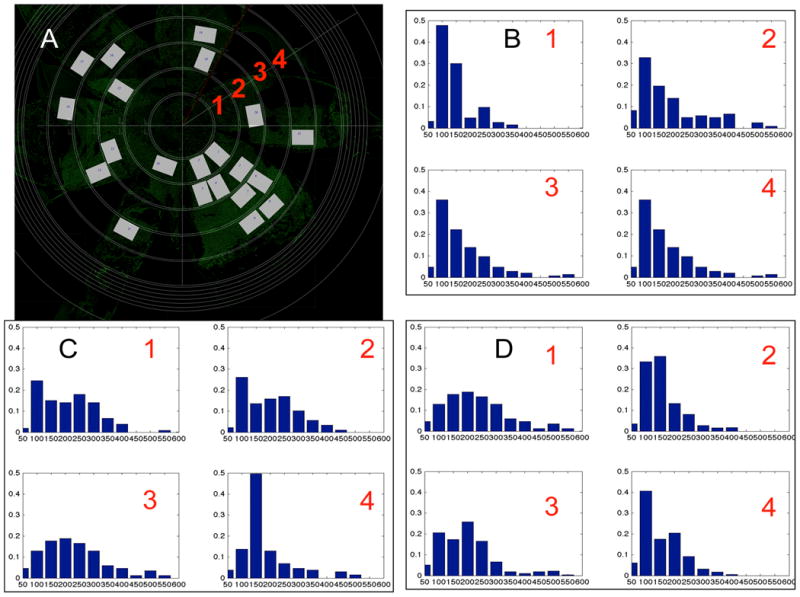
Inhomogeneous spatial distribution of morphology in experimental mouse RPE flat-mount data. (A) RPE flat-mount defining measuring zones 1-4 (red numbers). (B-D) Cell area distributions for four zones: (B) Wild-type mouse at P60; (C) IRBP mutant at P60; (D) RPE65 mutant at P60. While the WT distributions were tighter and more similar from one zone to the next, most of the other distributions were more spread out and revealed no obviously similar patterns of cell sizes.