
Figure 2.
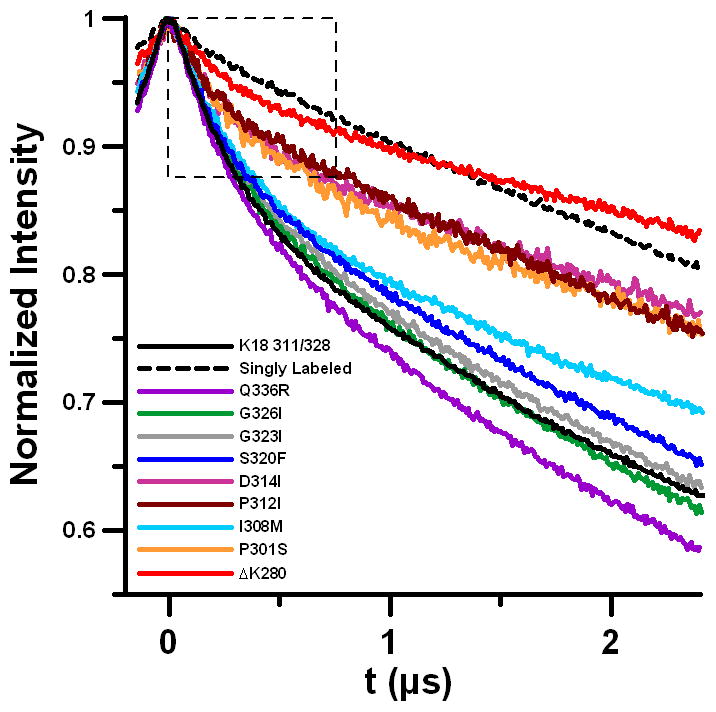
Overlay of raw DEER data for all mutants studied, including the K18 311/328 core and singly labeled monomer (all data are normalized to the maximum signal intensity = 1). The largest difference is apparent from the initial drop region as indicated by the dotted box.