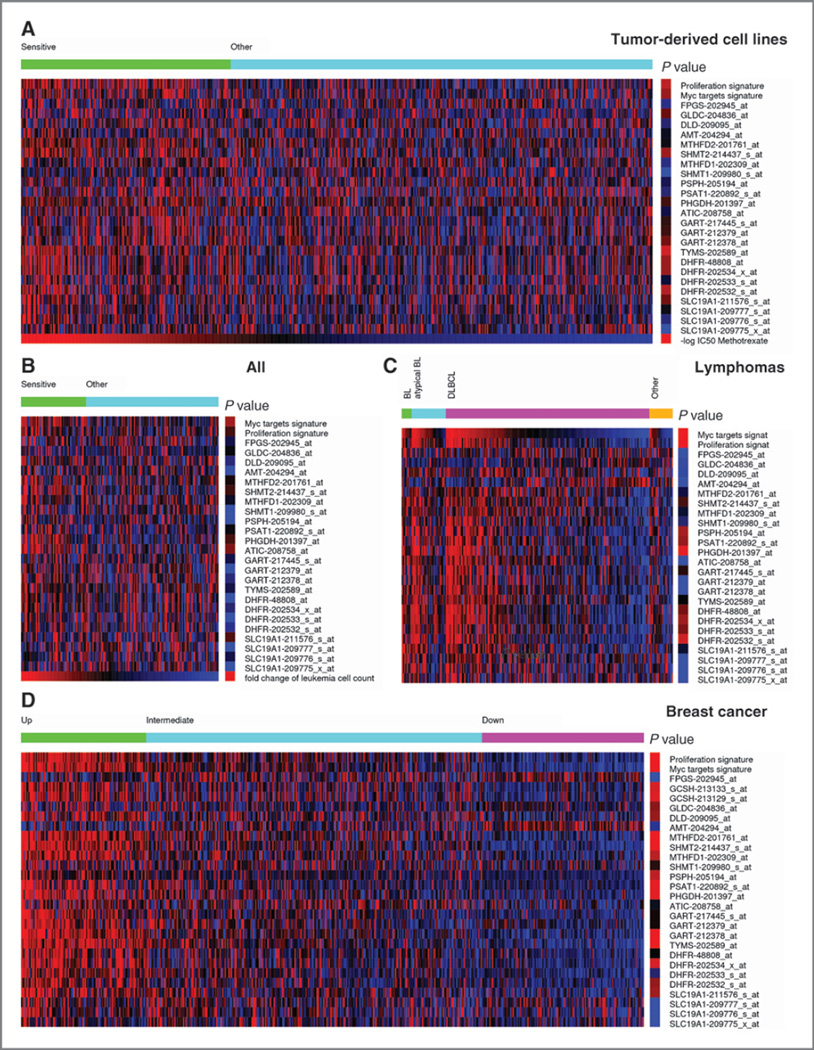
Figure 2.
Heatmap showing the expression of genes coding for enzymes in folate metabolism (blue, underexpressed; red, overexpressed). A, a collection of 515 tumor-derived cell lines sorted in decreasing order of their sensitivity for methotrexate (MTX), based on data from ref. (9). The samples were divided into 2 groups: sensitive (1/3 of samples with lowest IC50) and other (remaining samples). The right column shows a color-coded quantification of the P value for enrichment of samples with high expression (2-fold or above) in the sensitive group, whereas red indicates significantly enriched, the brighter the more significant, and blue not significantly enriched. B, a collection of 161 ALL sorted in decreasing order of their sensitivity to MTX, based on data from ref. (11). The samples were divided into 2 groups: sensitive (1/3 of samples with highest fold decrease in the leukemia cell count) and other (remaining samples). The right column shows a color-coded quantification of the P value as in A. C, a collection of 221 lymphomas grouped by subtype and sorted in decreasing order of c-myc gene signature, based on data from ref. (16). The right column shows a color-coded quantification of the P value for enrichment of samples with high expression (2-fold or above) among samples with a significant upregulation of the c-myc signature. D, samples from 508 breast cancers, based on data from ref. (18). The samples were divided in 3 groups with significant upregulation (top), nonsignificant (middle), and significant downregulation (Bottom) of the folate metabolism gene signature. The right column shows a color-coded quantification of the P value for enrichment of samples with high expression in the top group.

