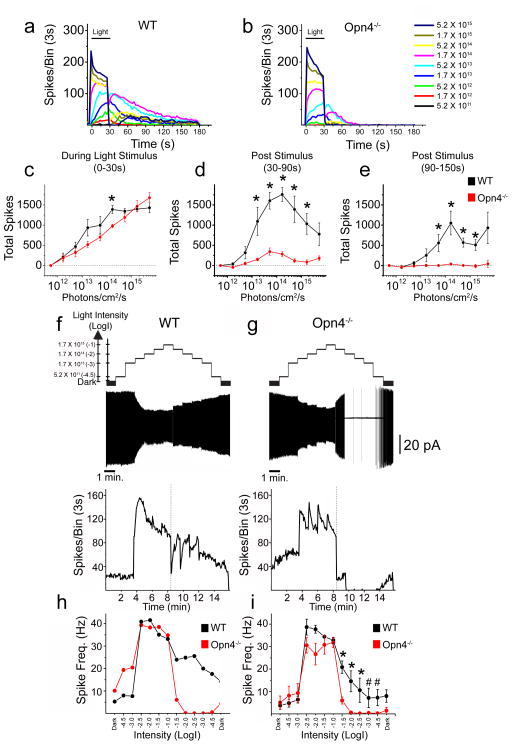
Fig. 3. Alpha RGCs signal long-term lighting history and irradiance.
ON alpha RGCs of WT and Opn4−/− mice were recorded extracellularly in loose patch or cell attached configuration. (a,b) Responses (spikes/3s bin) of WT (a) and Opn4−/− (b) ON alpha RGCs to increasing intensities of 480 nm light for 30s (horizontal black bar) at various intensities. (c) Mean ± SEM total spikes recorded during 30s light stimulus for ON alpha RGCs in WT (black, n = 4) and Opn4−/− (red, n = 5) retinas. (d) Mean ± SEM total spikes of ON alpha RGCs recorded 0–60s following light offset in WT (black) and Opn4−/− (red) retinas. (e) Mean ± SEM total spikes of ON alpha RGCs recorded 60–120s following light offset in WT (black) and Opn4−/− (red) retinas. (f,g) ON alpha RGCs were exposed to 1 minute steps of increasing and then decreasing irradiance from 5.2 × 10¹¹ to 1.7 × 10¹⁵ photons/cm2/s. Top panels show representative examples of WT (f) and Opn4−/− (g) ON alpha cells exposed to this light stimulus. Bottom panels show spikes/3s bin of same WT (f) or Opn4−/− (g) cells on the same timescale. Dotted line indicates point at which light intensities began to decrease. (h) Spike frequency for single WT (black) and Opn4−/− (red) cells shown in f and g over 1 minute at each light intensity (x axis = Log(intensity)). (i) Mean ± SEM spike frequency (Hz) for WT (black, n = 4) and Opn4−/− (red, n = 4) ON alpha cells over 1 minute at each light intensity (x axis = Log(intensity)). Horizontal scale bar (f,g) represents 1 minute of recording time and vertical scale bar (f,g) represents 20pA. * p < 0.05, # p = 0.057 (Mann-Whitney U test).

