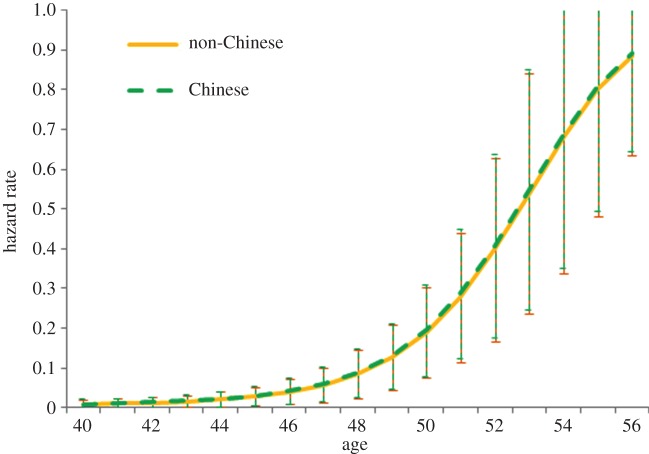
Figure 3.
Predicted hazard rate of progression to last menstruation based on discrete-time event history analysis for matched set of Chinese Indonesians and non-Chinese Indonesians, plotted at the means of covariates (see the electronic supplementary material, table S3 for full model). Error bars represent 95% CIs. (Online version in colour.)

