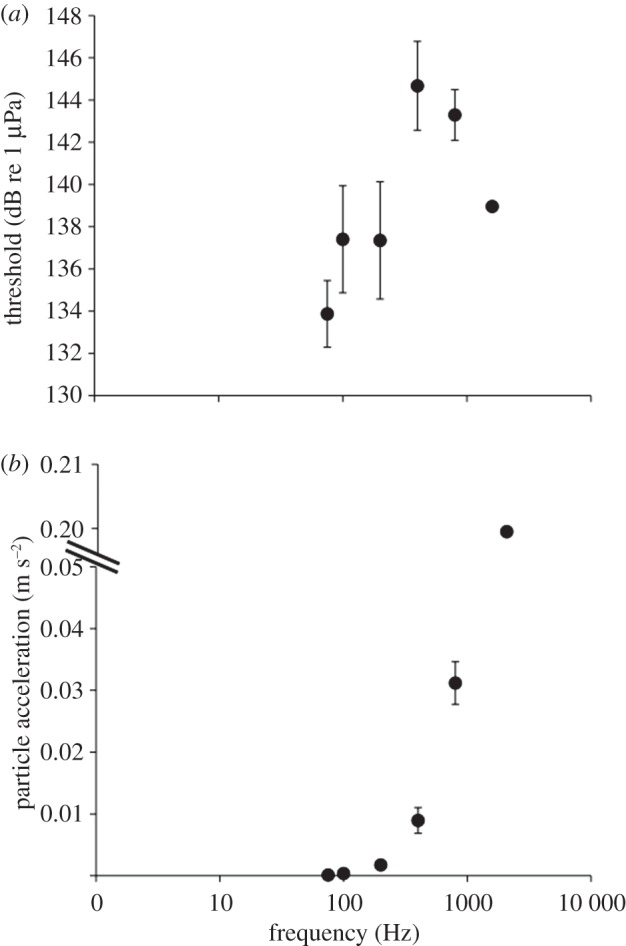
Figure 2.

Evoked potential audiograms in terms of (a) acoustic pressure and (b) acoustic particle acceleration, showing the lowest sound level that produced a detectable evoked potential. Eight crabs were tested at all frequencies. Lower values for thresholds and particle accelerations indicate greater sensitivity. Error bars represent ±1 s.e.
