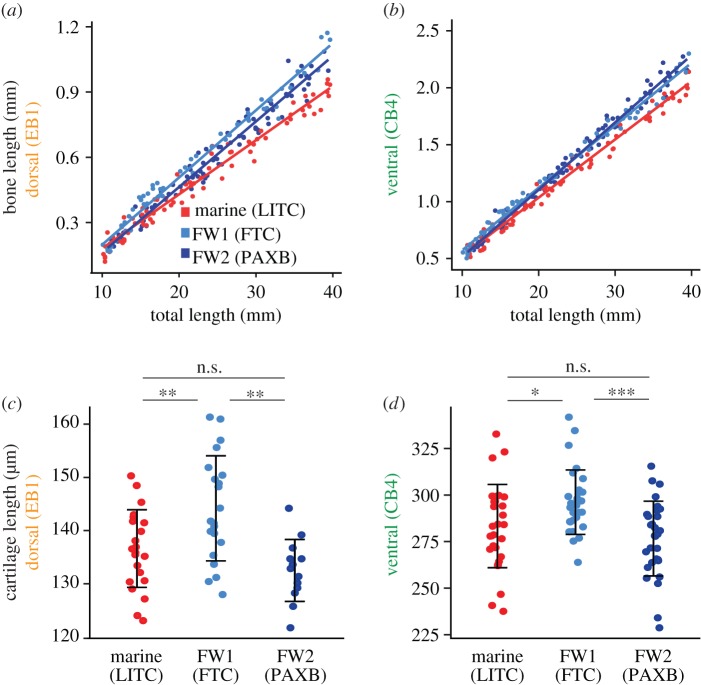
Figure 3.
Developmental basis of dorsal and ventral bone length differences. (a,b) Developmental time course of (a) dorsal (EB1) and (b) ventral (CB4) bone lengths plotted against total length of laboratory-reared fish under five months of age. Both bones show statistically significant differences in slope (bone growth rate) as well as y-intercept between marine and freshwater. ANCOVA statistics are shown in the electronic supplementary material, table S5; additional bones are shown in the electronic supplementary material, figure S2. Red, LITC; light blue, FTC; dark blue, PAXB. (c) EB1 and (d) CB4 cartilages are longer in FTC relative to LITC and PAXB fry (Tukey HSD p < 0.05 for LITC-FTC and PAXB-FTC comparisons of both cartilages). In (c), the FTC fish were slightly shorter in total length than the LITC and PAXB fish (Tukey HSD test p < 0.05), which makes the cartilage size increase even greater relative to body size. Error bars = standard deviation. Asterisks indicate Tukey HSD p-values: n.s., not significant; *p < 0.05, **p < 0.01, ***p < 0.001.

