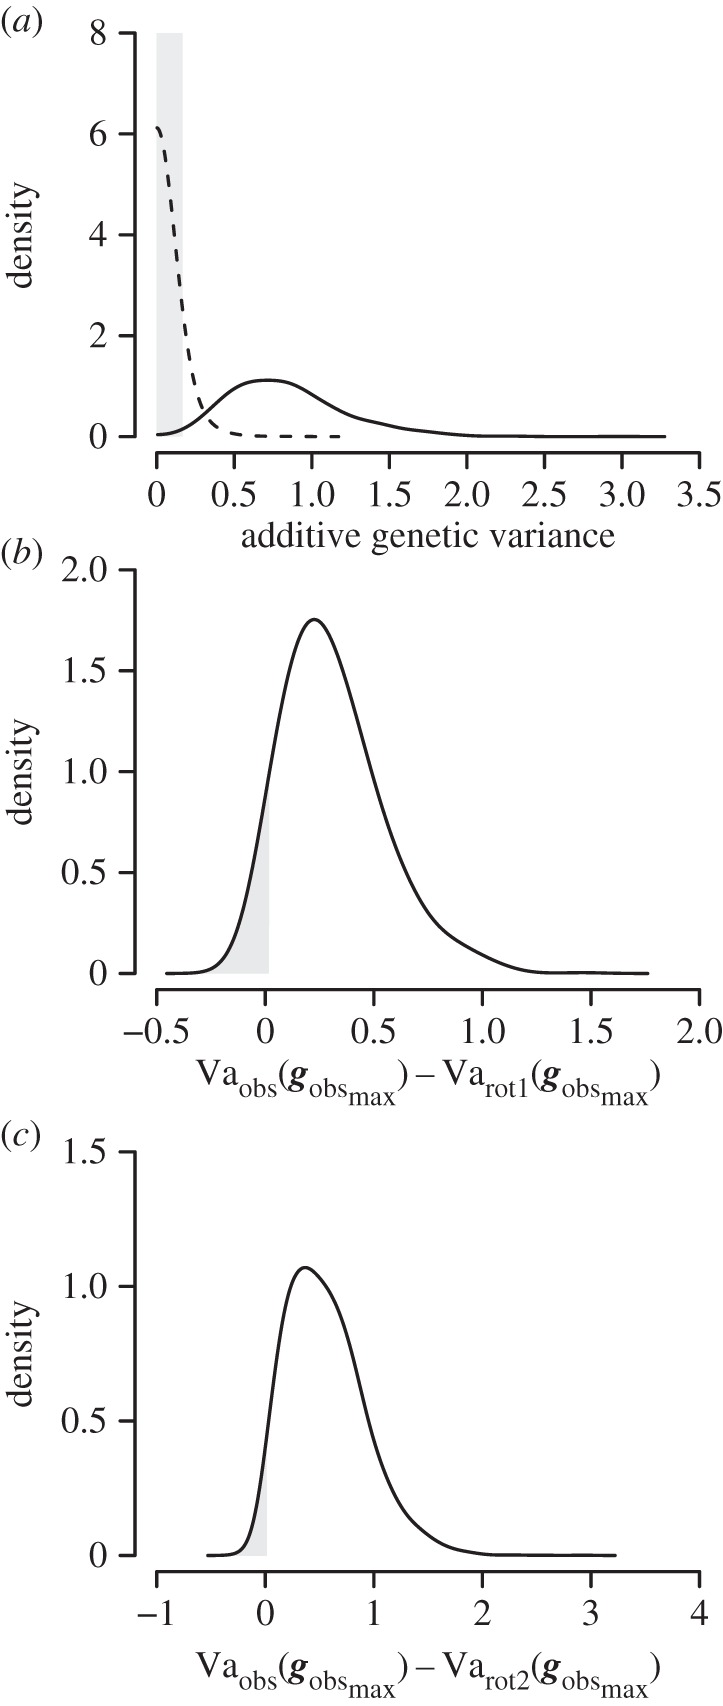
Figure 2.

(a) Posterior density distribution for the observed genetic variance (solid line) and the null genetic variance (dashed lines) of gobsmax. Grey area denotes the region of equivalence between the observed and null distribution. (b,c) Posterior density distribution for the difference in genetic variance between Vaobs(gobsmax) and Varot1(gobsmax) as well as the difference in genetic variance between Vaobs(gobsmax) and Varot2(gobsmax), (b) and (c), respectively. Grey areas denote the 5% lower posterior density interval.
